.png)
Q2 2026 Market Intelligence Report
Where we have been and where we are heading
Volumes are recovering and capital is back at the table, but the distribution isn't even. The gap between what trades cleanly and what sits is widening - and it's happening at the asset level, not the market level.
The transaction backlog keeps growing. Most of these assets, development and acquisition alike, carry a preferred return somewhere in the stack. Tension between operating and capital partners will persist as operating fundamentals gradually improve. That tension is creating fatigue, and fatigue could unlock part of the backlog.

KRIS MIKKELSEN
EVP & Co-Head, Capital Markets
The State of Multifamily





A tale of two recoveries
Multifamily transaction volume has recovered to within 3% of its pre-COVID average, but deal count is still running roughly 20% below that benchmark. That divergence isn't noise. It reflects capital concentrating in higher-quality assets as fewer B and C properties clear, average deal size climbs, and scarcity of institutional product holds pricing firm at the top of the stack. Loan maturities, merchant builder dispositions, and capital recycling will push the next leg of activity higher, though what trades and at what price has become an asset-level question.
Transaction activity
Market rate apartment property sales (#)

NMHC Outlook
Volumes are likely to continue rising as pent-up transaction backlog, merchant builder deliveries, loan maturities, and liquidity-driven sellers increasingly converge.
How it has played out
The backlog continues to build, with the forward WDIS pipeline remaining strong. First-half volumes were up slightly year-over-year, reflecting a more measured pace than predicted. The convergence of maturities, deliveries, and liquidity-driven sellers is still building toward a release, not yet showing up in realized volume. Bifurcation remains the defining feature, with capital continuing to crowd into “Haves” assets despite the softer volume.
Note: Pre-COVID average rolling-four quarter volume of $137B and $136B for rolling-four ending Q2 ‘26 (pulled 7.19.26)
Source: Walker & Dunlop Internal Research, RCA
The return of the risk premium
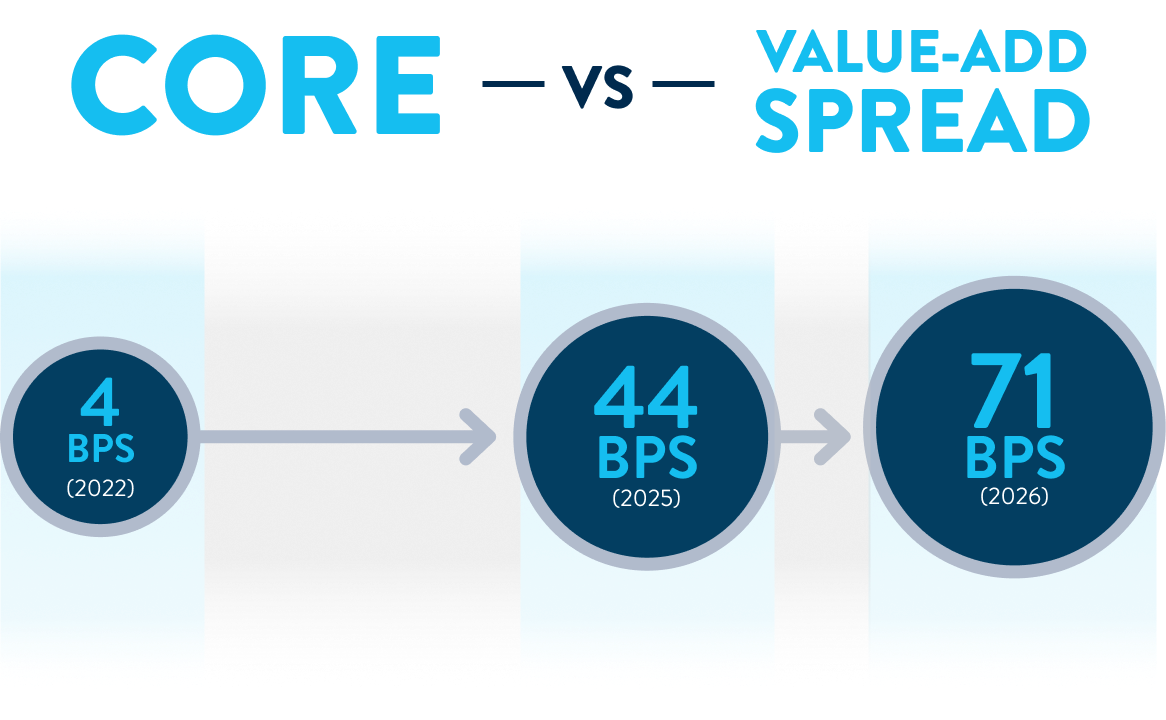
Pre-1990s assets, across Walker & Dunlop, have traded 90bps wider than the 2010s vintage. The spread between value-add and core has moved from 4bps to 71bps.
PRICING & PERFORMANCE DIVERGENCE
2025-2026 WALKER & DUNLOP CAP RATE BY VINTAGE
Note: Trailing adjusted average cap rate on W&D 2025-2026 closed market rate transactions.
Source: Walker & Dunlop Internal Research
ONE MARKET, THREE STRATEGIES
The same set of conditions reads differently depending on where you sit in the capital stack. Buyers who target durable in-place income and underwrite a realistic path to stabilized cash flow within 12 to 24 months are finding opportunity, with execution rather than cap rate compression as the return driver. For sellers, liquidity remains deep at the top of the market, and benchmarking go-forward upside against today's pricing support is the relevant frame. Owners with flexibility are using improved credit availability to extend, refinance, and move assets into a stronger competitive position before the next leg of transaction activity takes hold.
THE FULL PICTURE
The Q2 2026 Market Intelligence Report reveals a market defined by bifurcation. Capital concentrates into "Haves"—assets with stable revenue, limited supply pressure, differentiated product, conviction markets, attractive basis, and clear value-add potential. Institutional buyers maintain pricing power; everything else faces yield-driven pressures. This is the cycle itself. The full report goes deeper into what is occurring across the multifamily landscape.
