.jpg)
Read time:
5 mins
At the beginning of 2026, the multifamily market appeared ready to move forward. Capital was returning, transaction volume was building, and operating fundamentals were beginning to recover. We also expected the recovery to be uneven.
At the midpoint of the year, that view has largely proved correct.
The market is more active than it was at the cycle’s trough, but the recovery has not reached every asset, buyer, or geography equally. Capital is available. Credit is available. Demand is improving. Yet investors remain highly selective, and the difference between assets that attract capital and those that struggle to find liquidity continues to widen.
The key question for the second half is whether improving property fundamentals can overcome an interest rate environment that remains restrictive. Put more simply, what will matter more for transaction activity? Rates or rents?
Transaction activity is recovering, but the market remains highly selective
Rolling four-quarter multifamily transaction volume is now approximately in line with its pre-COVID average. That is meaningful progress, although first-half activity was more measured than many market participants expected.
The second half could look different. Historically, multifamily sales have been weighted toward the final six months of the year. In 2025, approximately 60 percent of market-wide volume occurred during the second half. Walker & Dunlop’s investment sales activity has been even more concentrated in the back half during recent years.
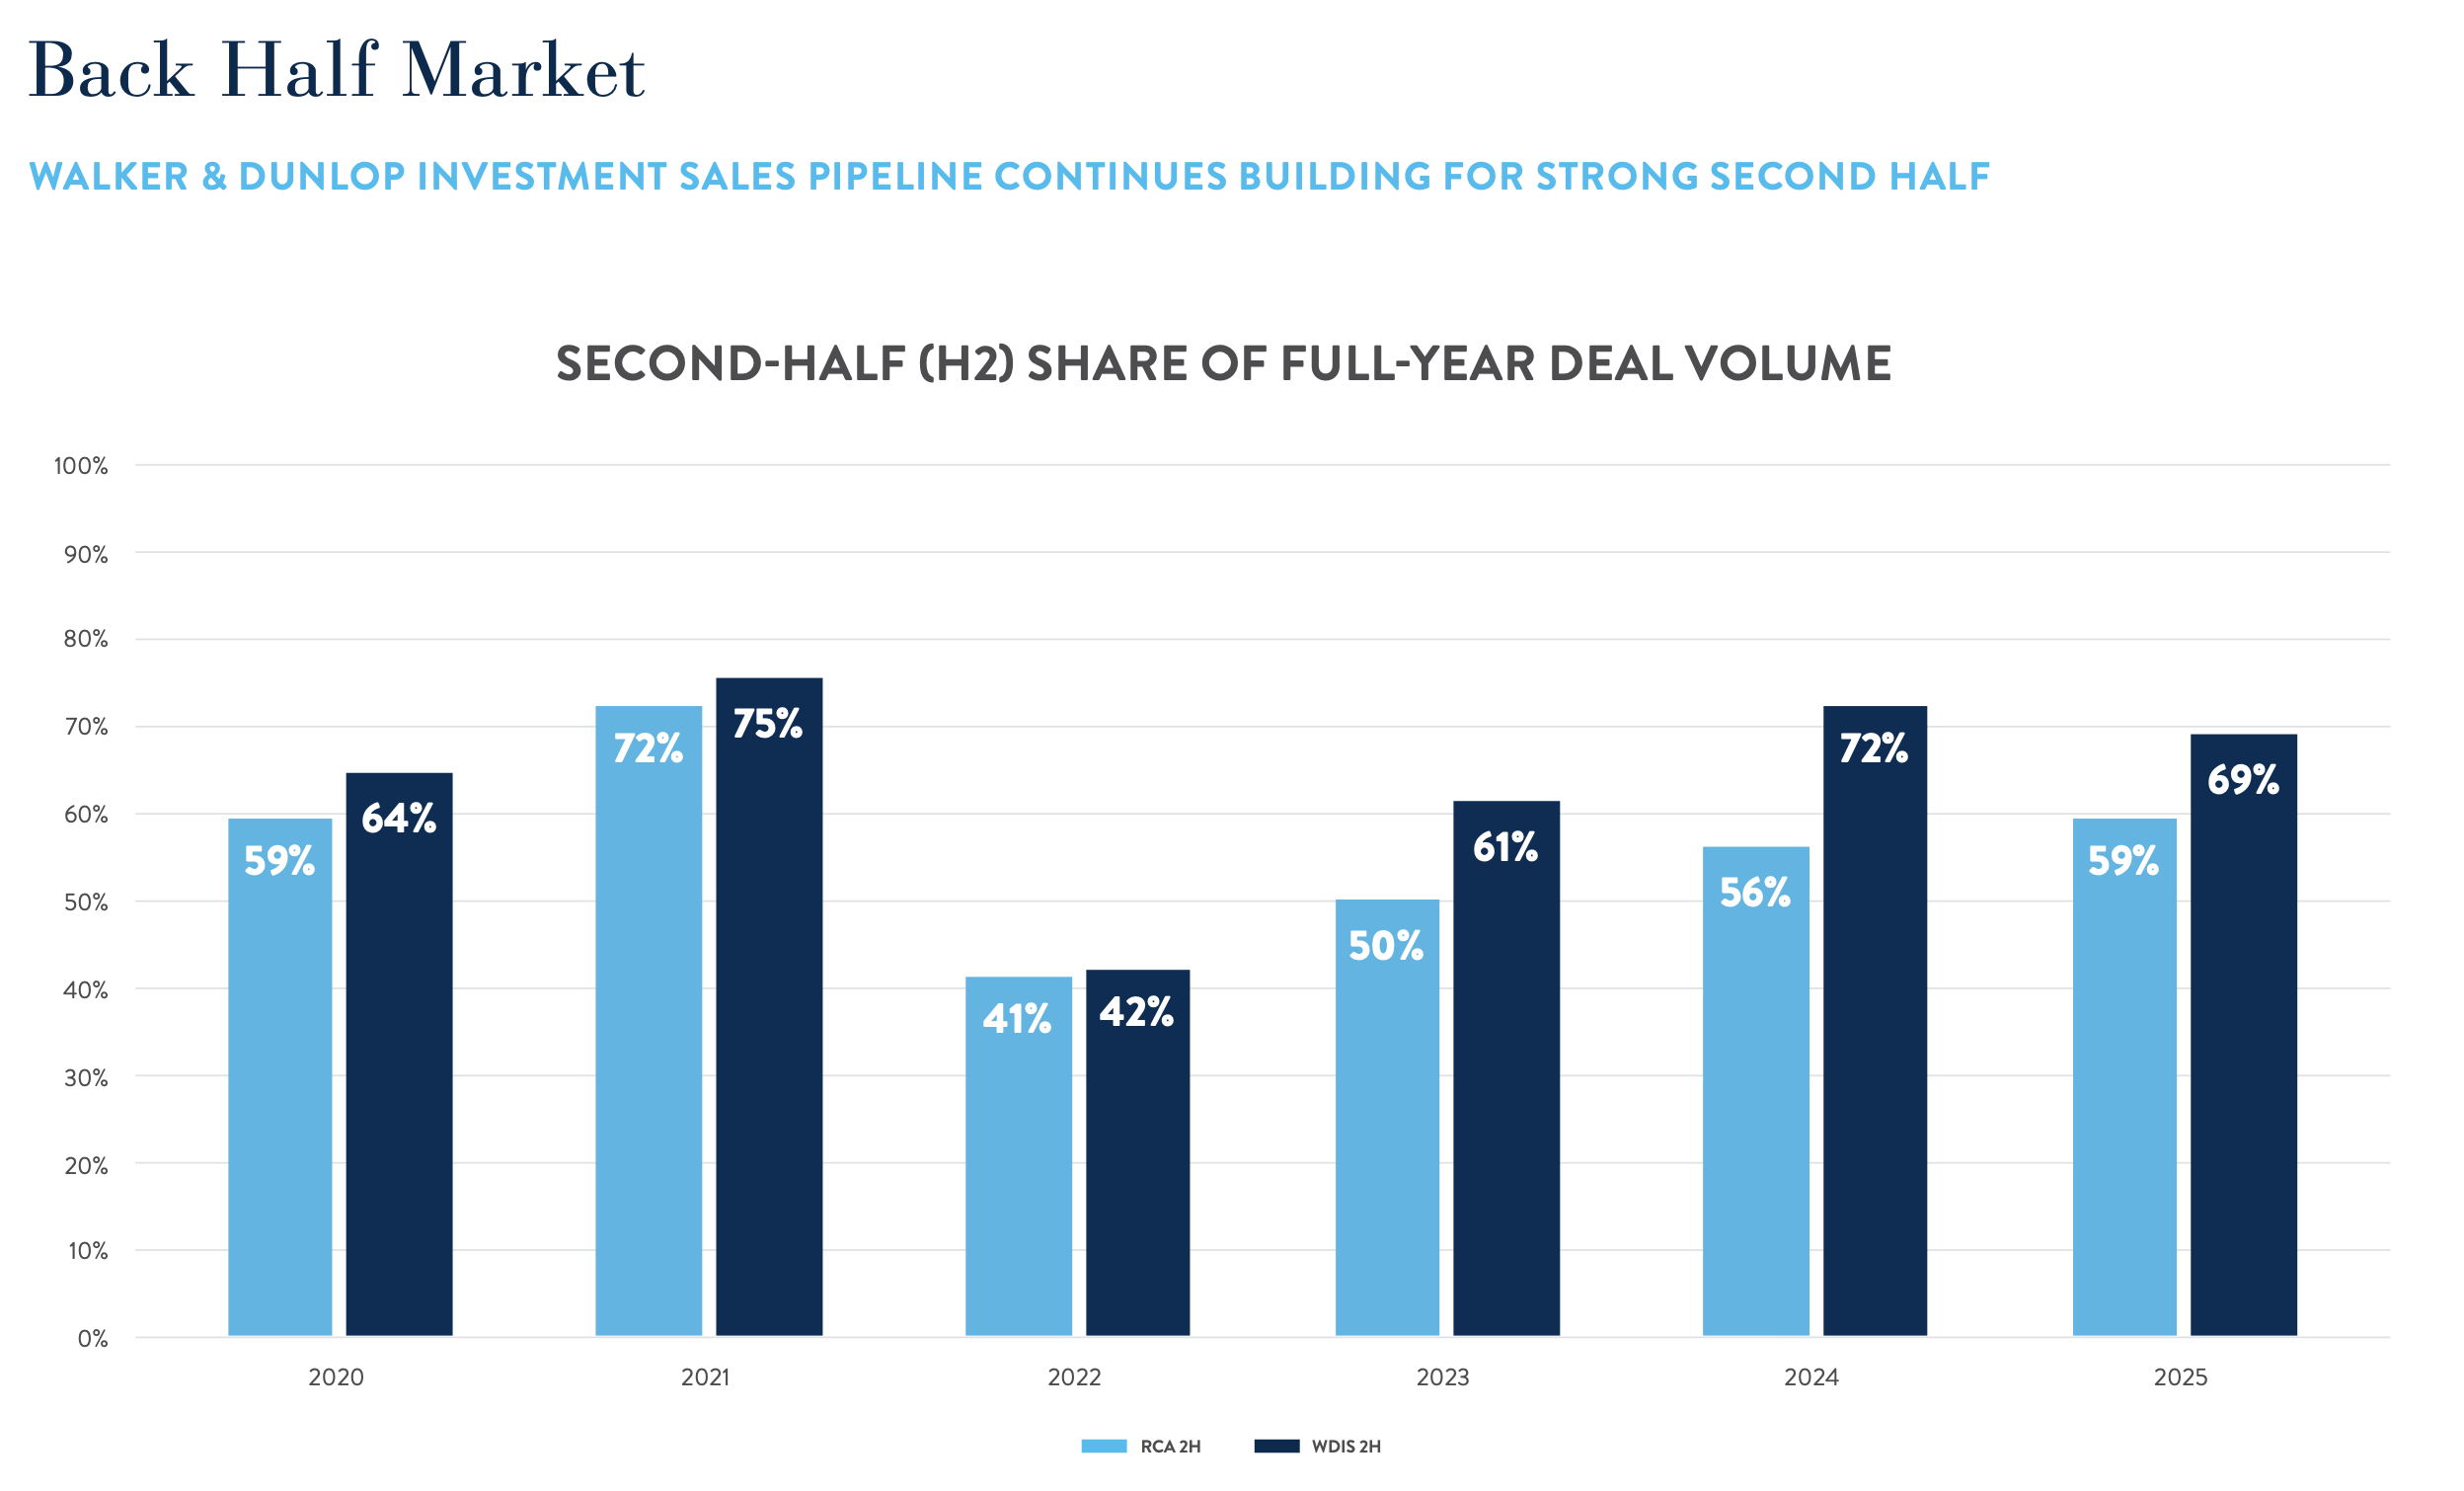
Source: MSCI RCA, Walker & Dunlop
Several forces continue to support a gradual increase in activity. Transaction pipelines are growing. Loan maturities are approaching. Merchant builders need to sell completed projects. Some owners require liquidity, while others are reassessing assets that no longer meet their return objectives.
Still, rising volume will not produce equal liquidity across the market.
Capital is concentrating around what we refer to as the “Haves.” These assets typically combine several advantages: stable or improving revenue, limited exposure to new supply, differentiated product, an attractive basis relative to replacement cost, and a clear path to value creation.
Assets without those characteristics face a more difficult market. While the near-term growth story is limited, buyers require additional yield or a lower entry basis. Without meaningful rate relief, that divide is likely to remain in place.
Stable cap rates do not mean uniform pricing
Headline cap rates have remained near 5 percent. On the surface, that suggests pricing has stabilized.
The average, however, does not capture the full market.
Pricing varies significantly by asset quality, vintage, location, and operating profile. Newer properties and assets with visible income growth continue to trade at tighter cap rates. Older properties, particularly those with capital needs or uncertain revenue prospects, require wider yields.
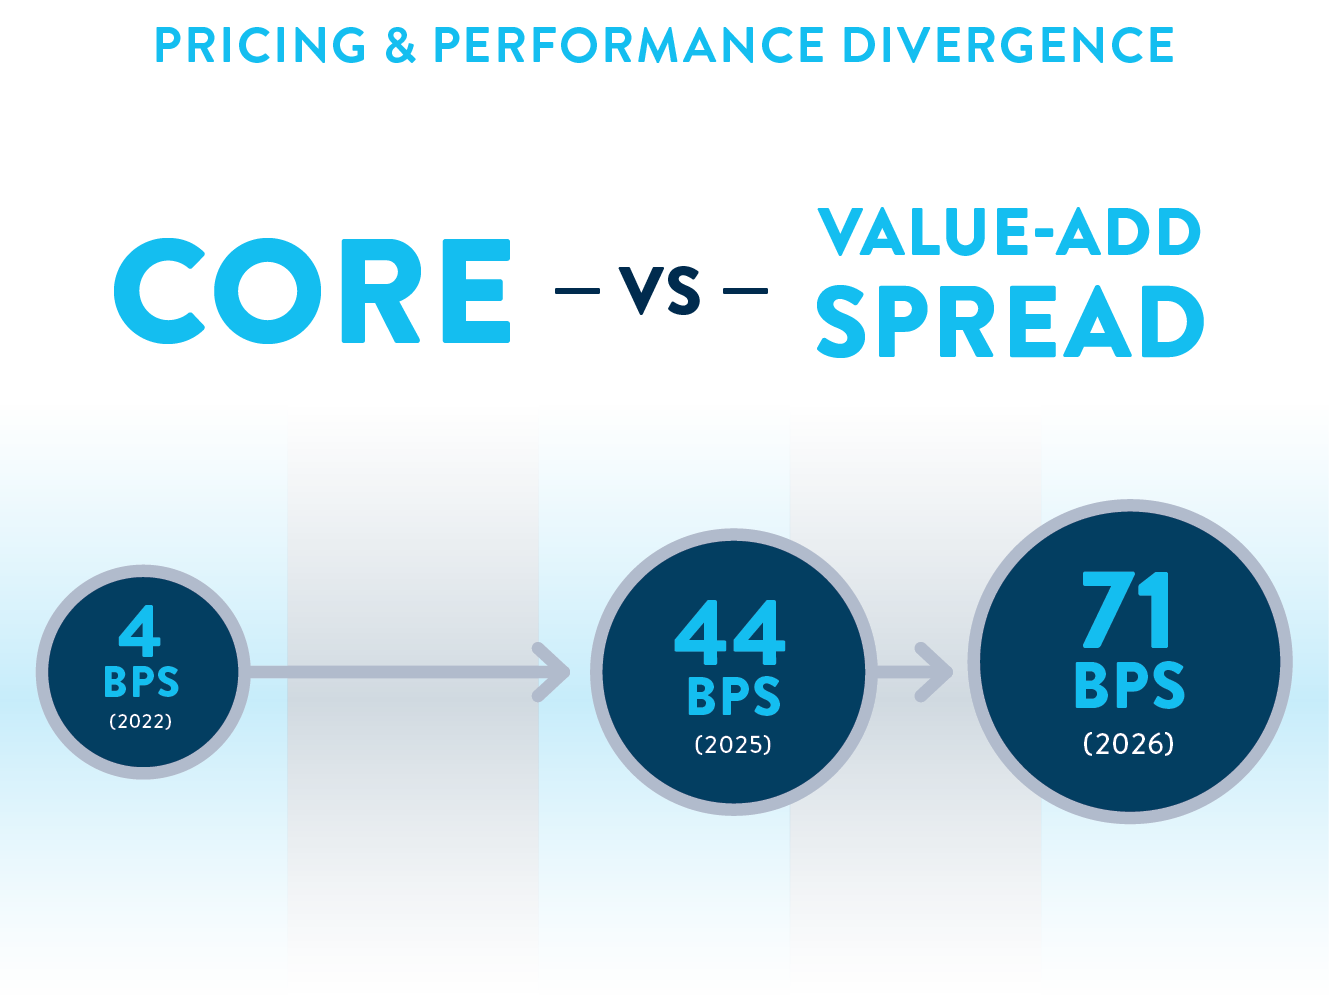
Source: Walker & Dunlop
The gap between core and value-add pricing illustrates the change. During 2021 and 2022, value-add assets traded almost in line with core properties. The risk premium was close to nonexistent. By 2026, the spread had widened to 71 basis points.
This is not simply a reaction to higher interest rates. It reflects a broader reassessment of risk.
Buyers are placing greater value on durable cash flows, predictable execution, and downside protection. They are paying less for assumptions and more for evidence. Strong historical performance, a differentiated product, and a credible operating plan now carry a measurable pricing advantage.
Income and basis have replaced aggressive growth assumptions
Source: Zelman & Associates
The underwriting environment has changed substantially since the zero-rate period.
In 2021 and 2022, investment returns often depended on strong rent growth, inexpensive debt, renovation premiums, and cap rate compression. Today’s buyers are using more conservative assumptions. They are underwriting lower near-term rent growth, wider exit cap rates, and moderate leverage.
At the same time, higher going-in yields are supporting stronger projected returns. The report shows average levered return targets rising even as first-year rent growth assumptions have fallen.
That combination is important. Buyers no longer need outsized growth to justify an acquisition. They need the right basis, durable income, and a realistic path to stabilized performance. Outperformance will increasingly depend on operational execution rather than a bet on interest-rate relief.
The reset in property values also creates a favorable comparison with replacement cost. Construction costs remain elevated, and development is still difficult to pencil. Existing assets can therefore offer an attractive basis advantage, particularly when they trade at a meaningful discount to the cost of building a comparable property.
For investors, the most compelling opportunities are increasingly those where execution drives the return. A successful investment case should not depend on lower interest rates or renewed cap rate compression.
Fundamentals are improving as the supply cycle turns
The operating environment is beginning to strengthen.
First-half 2026 apartment absorption was the second best first half on record. Occupancy has improved, resident retention remains healthy, and the gap between the cost of renting and owning continues to support apartment demand.
Supply is also moving in the right direction. Multifamily starts are approximately 55 percent below their 2022 peak. The near-term picture is more nuanced. Completions remain elevated and the market is working through the delivery pipeline. The decline in new starts is creating a clearer path toward balance.
Pricing power has not fully returned. New move-in rent growth remained slightly negative in June, and concessions continue to affect front-end pricing. Renewal rent growth remains positive, helping support blended rent growth as strong retention offsets declines in new lease growth. Even so, operators continue to compete with a sizable wave of new deliveries in many markets.
The sequence is becoming clearer. Occupancy improves first. Concessions begin to decline. New lease pricing follows. That process has started, but it will take time and will vary significantly by market. The next phase is unlikely to look like a broad, uniform upswing. Performance is increasingly separating by market, submarket, and individual asset, making local supply dynamics and execution more consequential.
Supply and demand are defining market performance
One of the report’s clearest takeaways is the difference between leading and lagging markets.
The strongest rent growth is concentrated in lower-supply coastal and Midwest markets, including San Francisco, San Jose, New York, Chicago, Milwaukee, and Minneapolis. Many of these markets experienced limited construction and modest population growth, yet their operating performance has improved.
Several high-growth Sun Belt markets show the opposite pattern. Population and employment expanded, but apartment supply grew even faster. As a result, markets such as Austin, San Antonio, Phoenix, Charlotte, Tampa, and Dallas continue to face pressure on rents and occupancy.
The difference between the leading and lagging groups is substantial. The report identifies a rent growth spread of more than six percentage points and a trailing five-year supply growth difference of more than 12 percentage points.
This challenges the idea that population growth alone determines multifamily performance. Demand matters, but supply determines how much of that demand translates into rent growth.
For investors, broad regional labels are becoming less useful. The relevant analysis increasingly takes place at the submarket and asset level. Location, competitive supply, product design, resident profile, and operating execution can produce very different results within the same metropolitan area. Those rankings should not be mistaken for a permanent hierarchy. These comparisons are a snapshot in time. Long-term investment decisions still require a view on where population and job growth are heading, how future supply will respond, and how those forces will shape performance through the cycle.
The second half will test the strength of the recovery
The multifamily market is in a better position than it was a year ago. Transaction volume has normalized. Cap rates have stabilized. Credit remains available for qualified assets and sponsors. Demand is absorbing supply at a healthy pace, and the development pipeline is beginning to contract.
The market is also more demanding.
Investors are distinguishing more carefully between durable performance and temporary momentum. Buyers are underwriting income rather than financial engineering. Sellers are finding the deepest liquidity where revenue visibility and asset quality are strongest. Owners are using refinancing and recapitalization to preserve flexibility and improve their competitive position.
The recovery will continue, but it is unlikely to lift every asset at the same pace.
The most successful strategies will begin with a clear understanding of basis, income, supply, and execution risk. In this phase of the cycle, precision matters more than broad market exposure. The opportunity is not simply in multifamily. It is in identifying the right assets within multifamily.
Download the full report
As the multifamily market continues to evolve, knowing where conditions are shifting and where opportunity is emerging can make all the difference. Walker & Dunlop's quarterly Market Intelligence Report brings together the trends, data, and market intelligence shaping investment decisions in the year ahead.
Explore the full Q2 2026 Market Intelligence Report for a clearer view of what’s ahead and what it could mean for your strategy.
Trending
Related insights & perspectives
News & Events
Find out what we’re doing by regularly visiting our news & events page.
Walker Webcast
Gain insight on leadership, business, the economy, commercial real estate, and more.