FIRST QUARTER 2026 HIGHLIGHTS
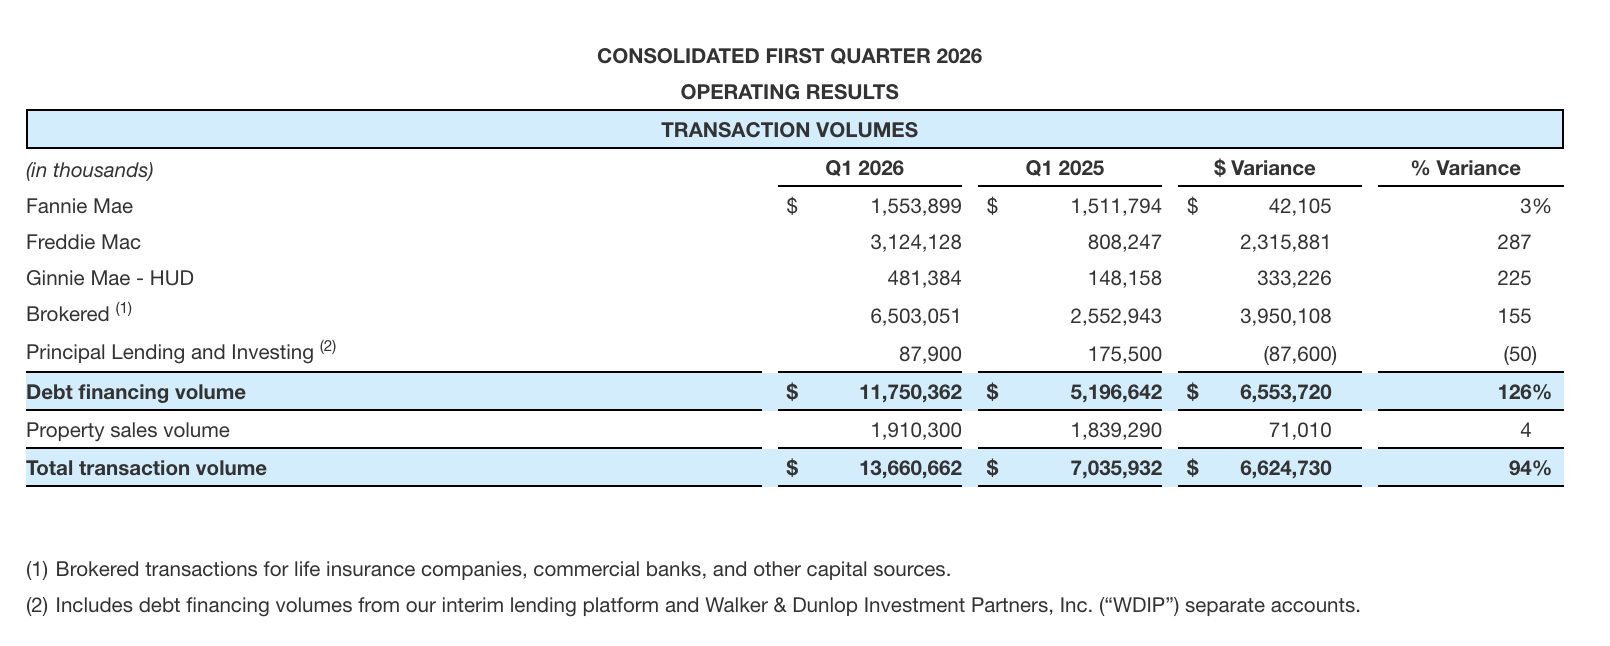
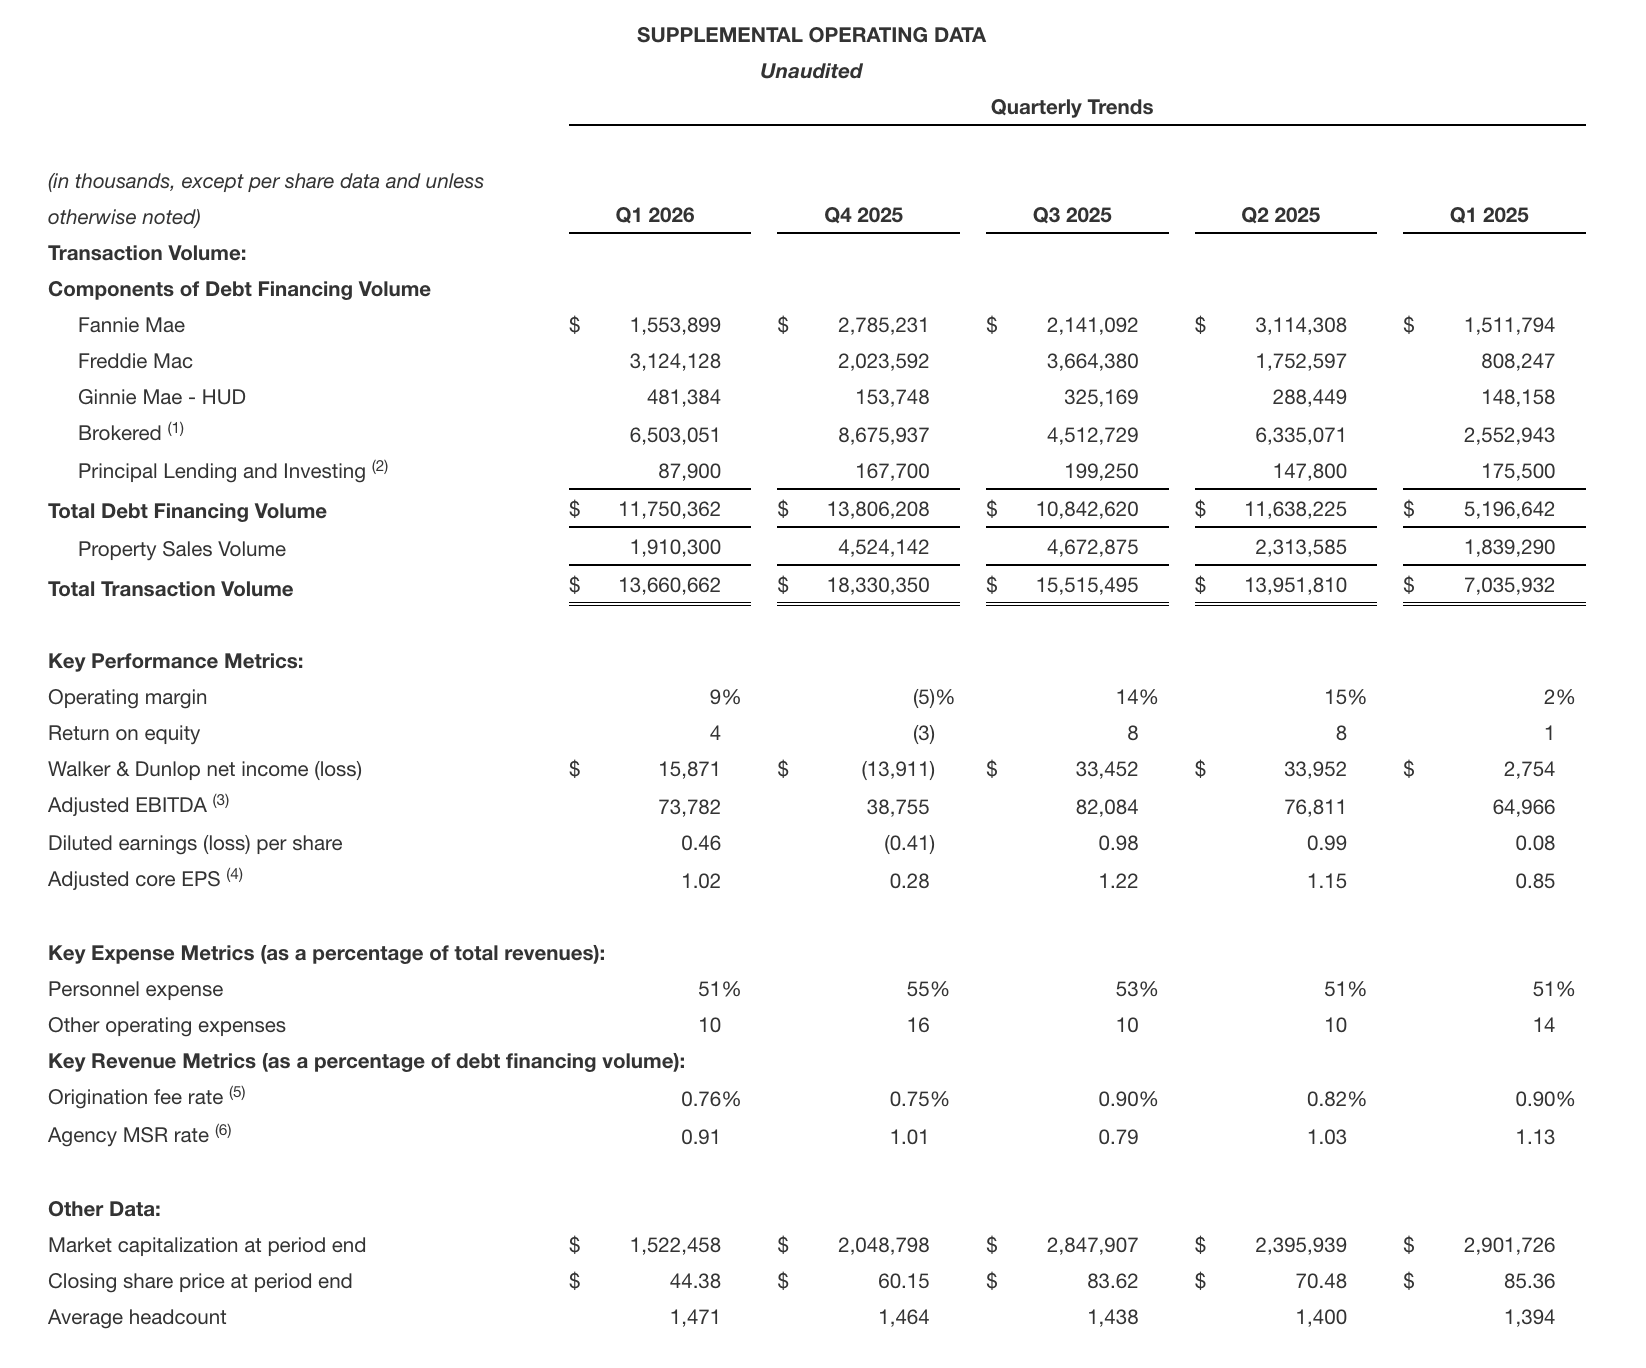
- Total transaction volume of $13.7 billion, up 94% from Q1’25
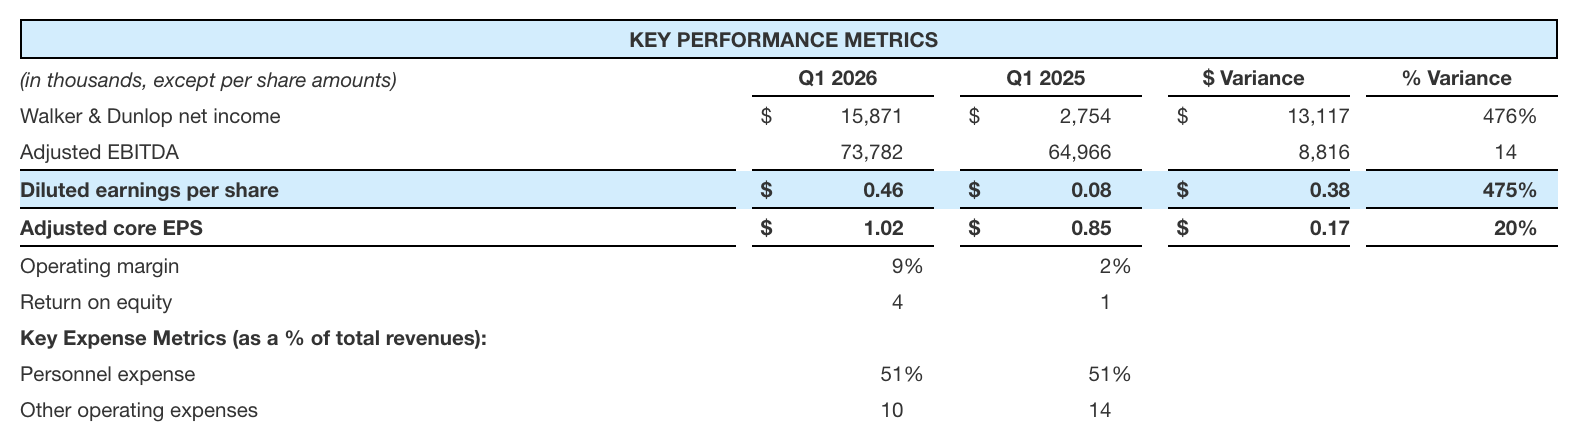
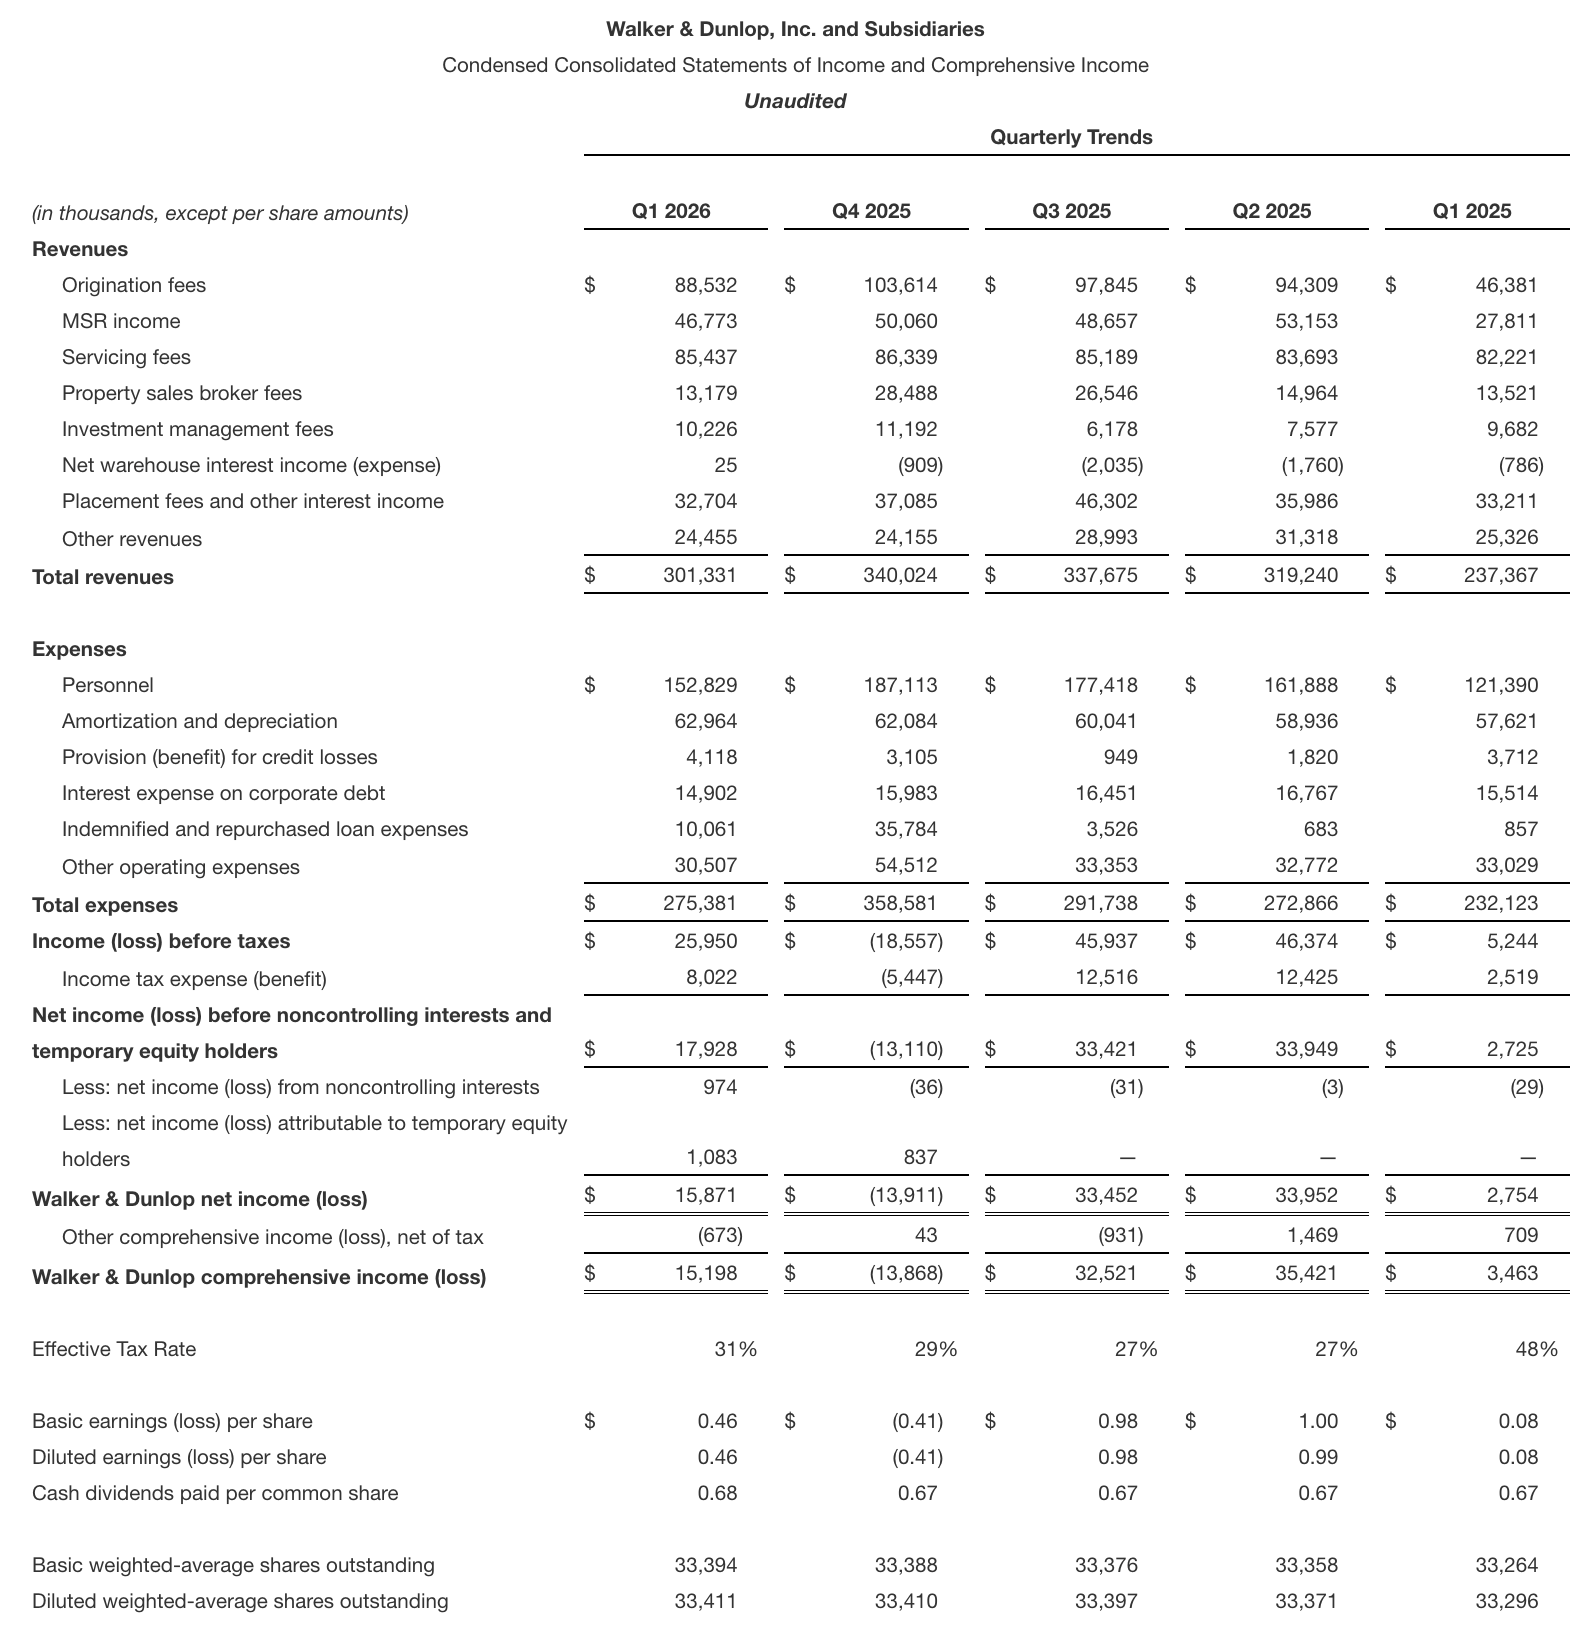
- Total revenues of $301.3 million, up 27% from Q1’25
- Net income of $15.9 million and diluted earnings per share of $0.46, up 476% and 475%, respectively from Q1’25
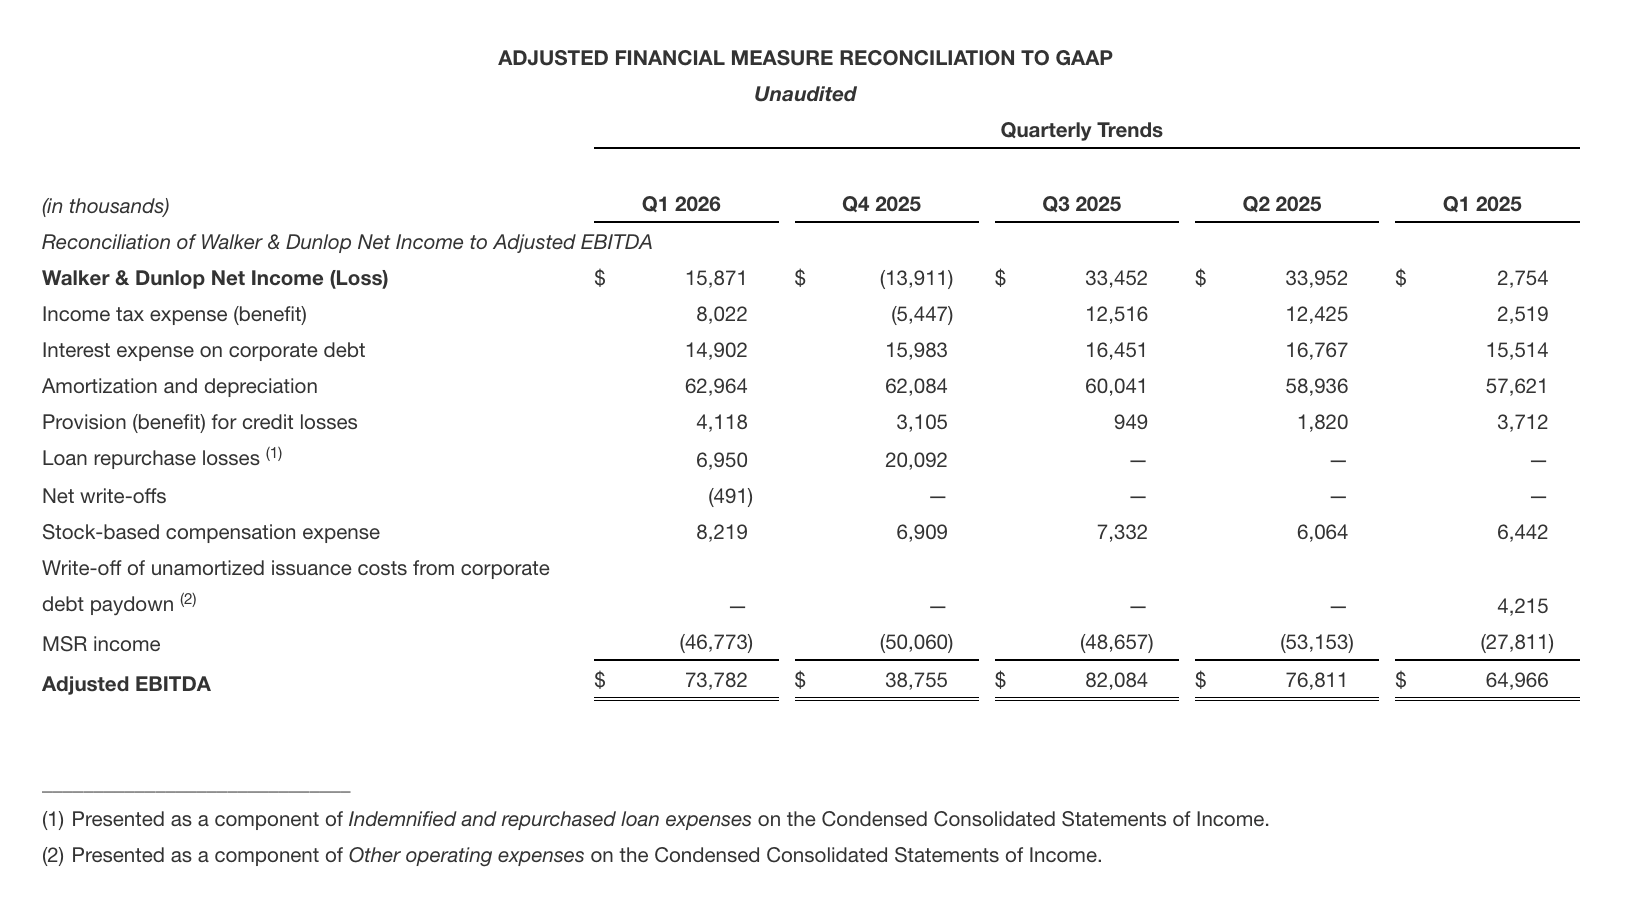
- Adjusted EBITDA(1) of $73.8 million, up 14% from Q1’25
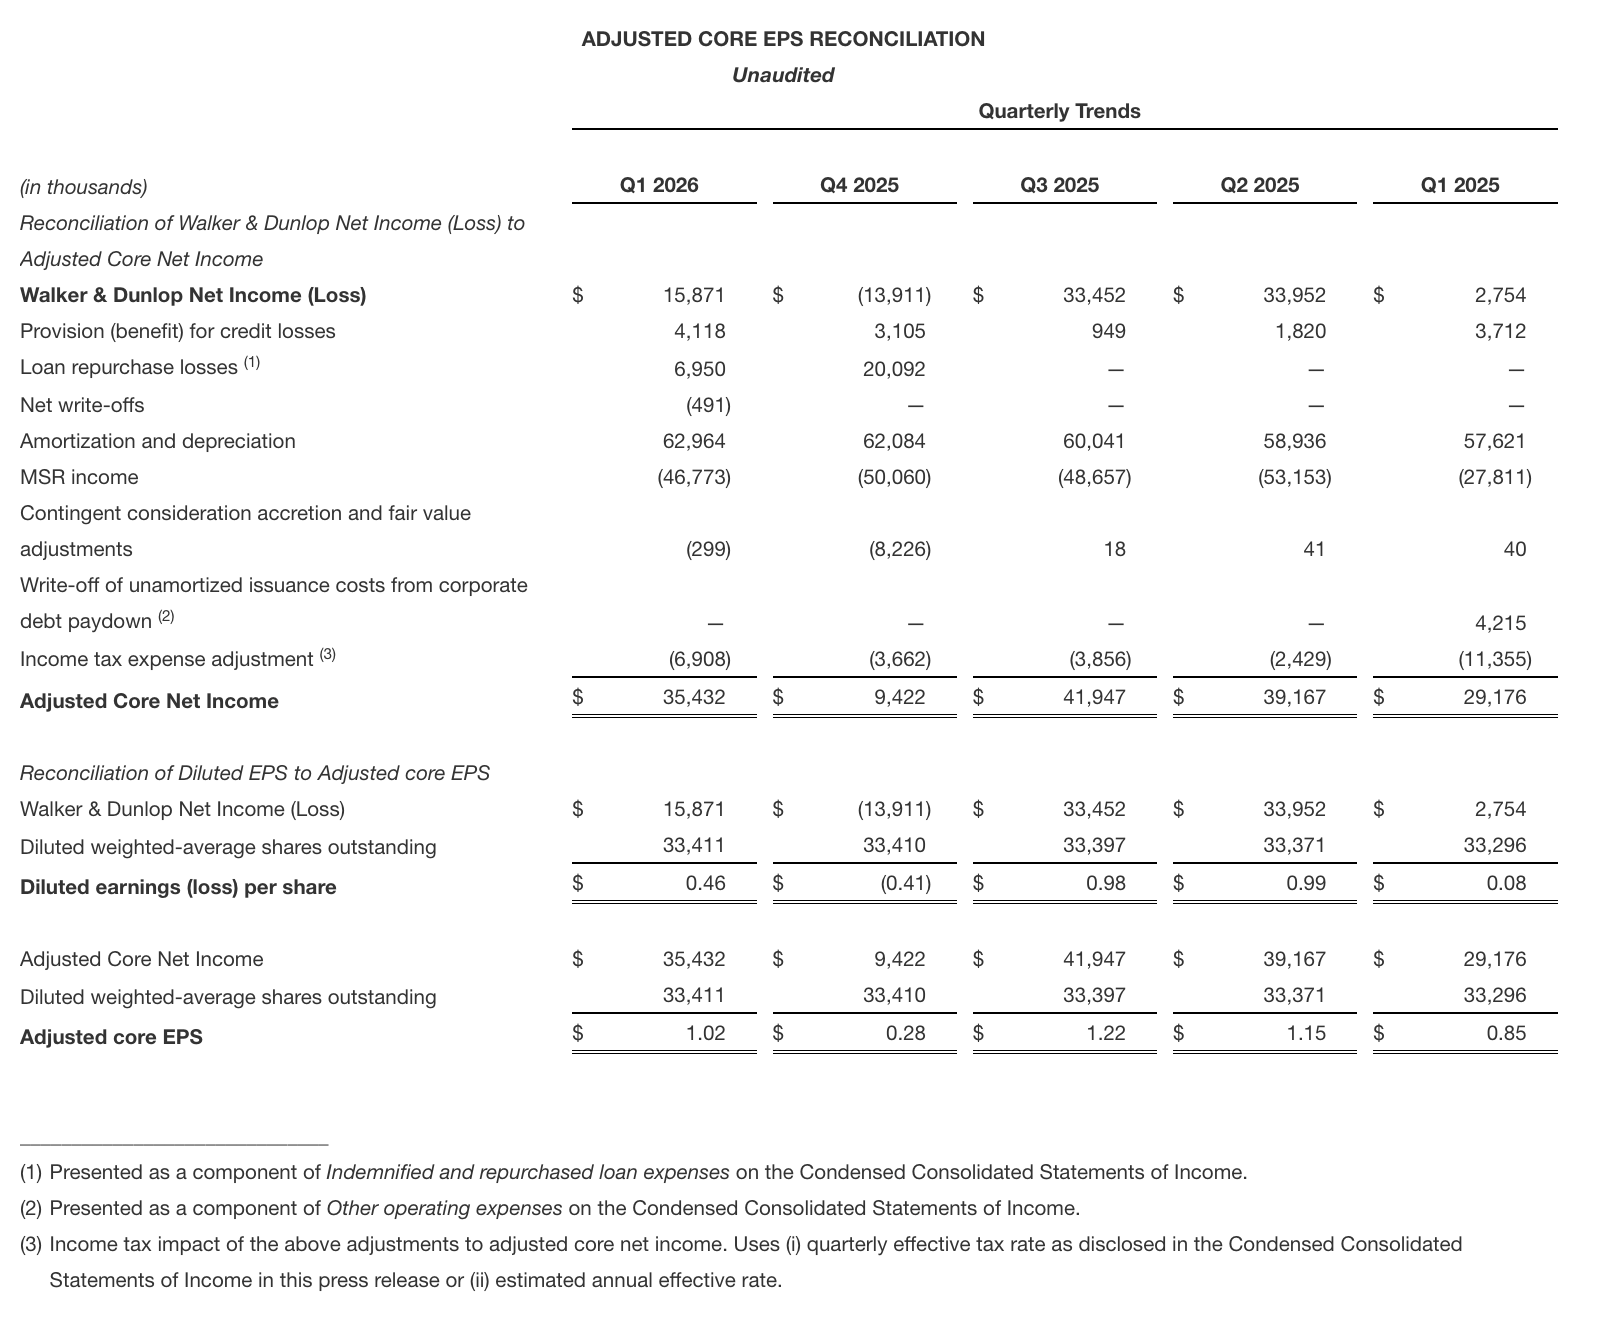
- Adjusted core EPS(2) of $1.02, up 20% from Q1’25
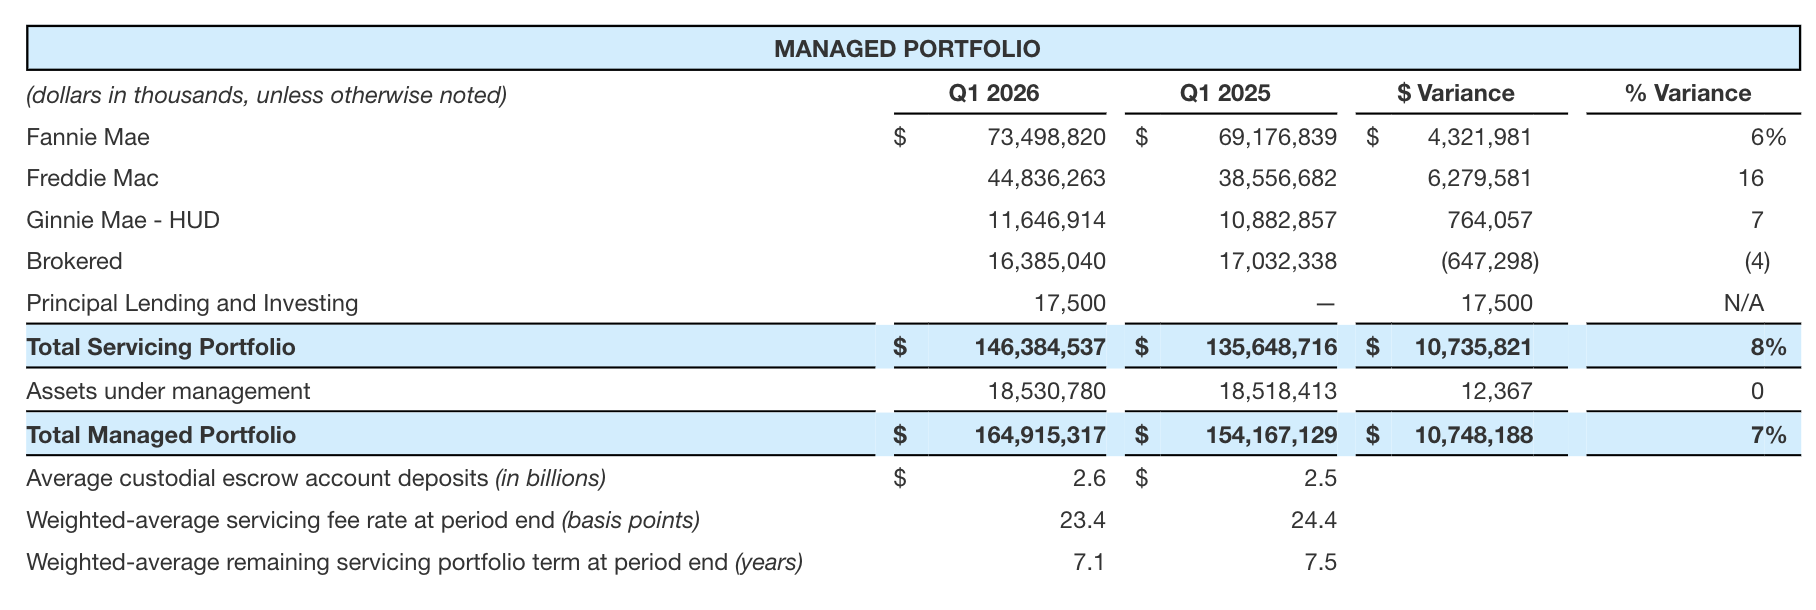
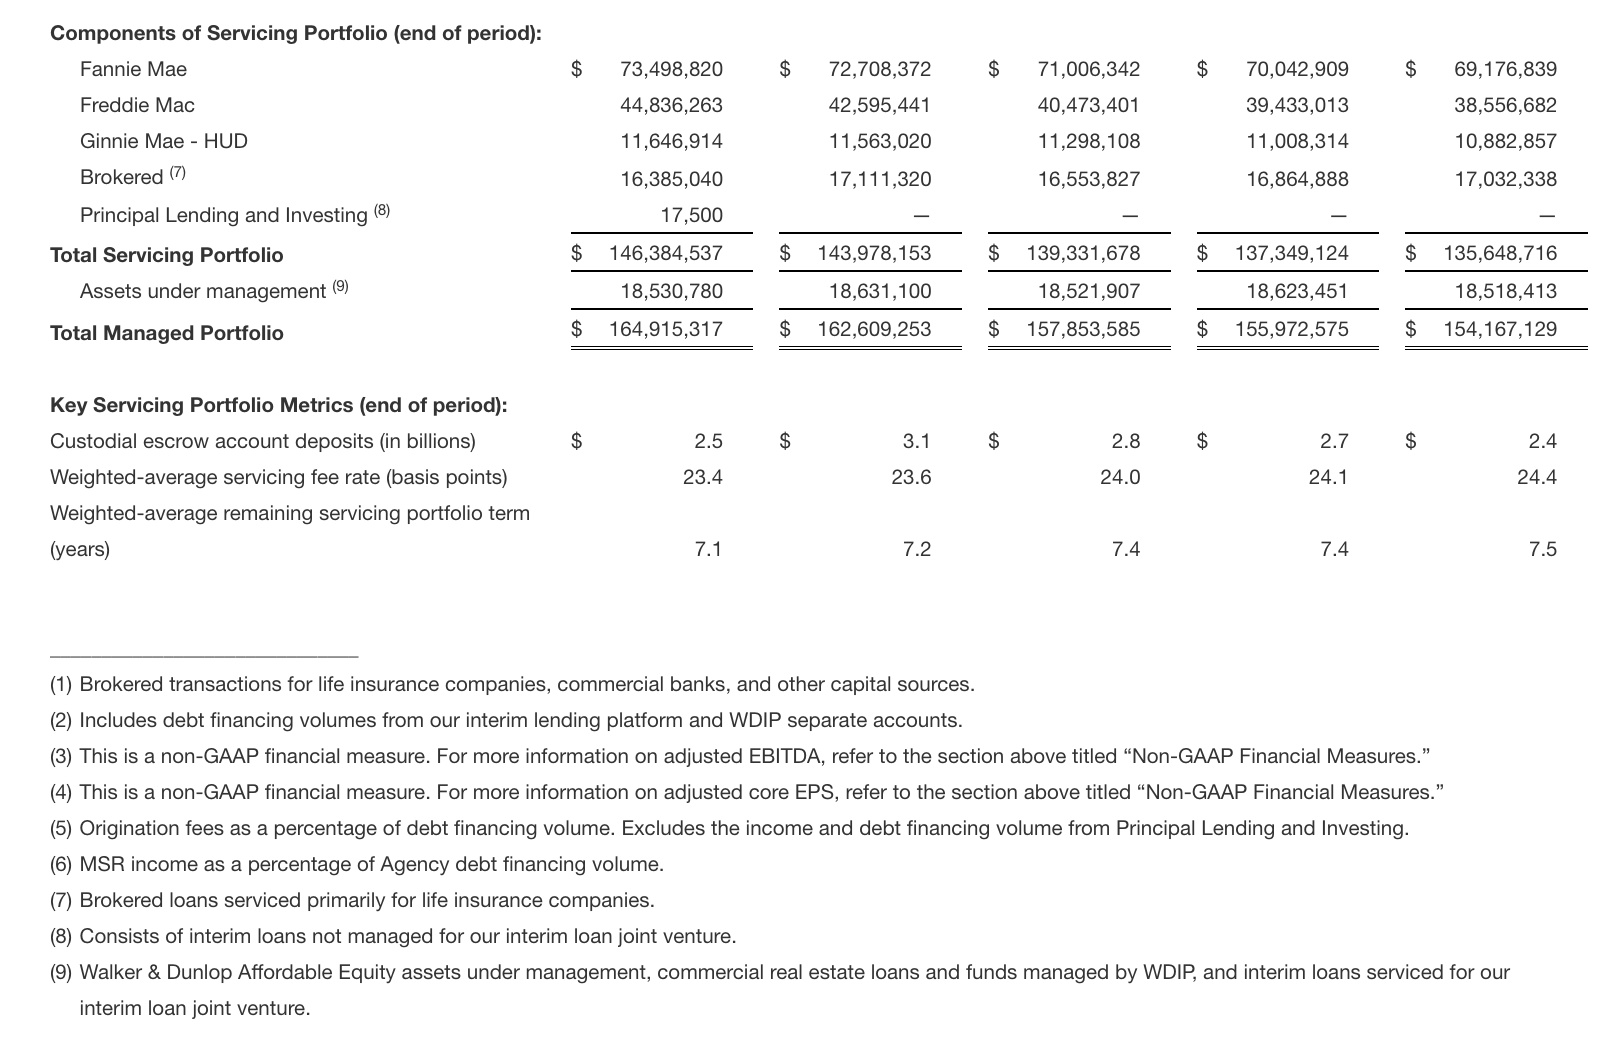
- Servicing portfolio of $146.4 billion as of March 31, 2026, up 8% from March 31, 2025
- Repurchased $13.3 million shares of common stock during the quarter at a weighted average price of $47.13
Walker & Dunlop, Inc. (NYSE: WD) (the “Company,” “Walker & Dunlop” or “W&D”) reported a strong first quarter of 2026, highlighted by a significant increase in total transaction volume to $13.7 billion, a 94% increase year over year. Total revenues grew 27% to $301.3 million, driving a 476% increase in net income to $15.9 million, or $0.46 per diluted share.
The Capital Markets segment delivered improved operating margins and profitability as continued strength in origination activity expanded the Company’s servicing portfolio by 8% year over year. Adjusted EBITDA increased 14% in the first quarter of 2026, and adjusted core EPS was up 20% year over year to $1.02. Results this quarter also include $10 million of indemnified and repurchased loan expenses, which the Company continues to actively manage. The first quarter of 2026 demonstrates the earnings power of Walker & Dunlop’s platform as market activity improves.
“The strength of our first-quarter transaction volumes and earnings is due to the W&D team, our brand, and our market position as one of the very best commercial real estate capital markets firms in the world,” commented Willy Walker, Walker & Dunlop’s Chairman and CEO. “Strong financing volumes generated robust quarterly transaction fees, which, coupled with recurring servicing and asset management fees, generated solid quarterly earnings as we begin the pursuit of our annual and five-year financial goals.”
Walker continued, “We enter the second quarter with a strong pipeline across all executions, customer segments, and geographies. While the macro environment remains challenging -- marked by interest rate volatility, high oil prices, and the Iran conflict -- many clients continue to transact due to loan maturities, the need to return capital to investors, and investment opportunities across the country. We remain confident in our 2026 outlook and in our ability to grow our company in the coming quarters and years.”
(1) Adjusted EBITDA is a non-GAAP financial measure the Company presents to help investors better understand our operating performance. For a reconciliation of adjusted EBITDA to net income, refer to the sections of this press release below titled “Non-GAAP Financial Measures,” “Adjusted Financial Measure Reconciliation to GAAP” and “Adjusted Financial Measure Reconciliation to GAAP by Segment.”
(2) Adjusted core EPS is a non-GAAP financial measure the Company presents to help investors better understand our operating performance. For a reconciliation of Adjusted core EPS to diluted EPS, refer to the sections of this press release below titled “Non-GAAP Financial Measures” and “Adjusted Core EPS Reconciliation.”
DISCUSSION OF QUARTERLY RESULTS:
- Total transaction volume grew 94% to $13.7 billion in the first quarter of 2026, reflecting Walker & Dunlop’s strong position within an increasingly active commercial real estate transactions market.
- Fannie Mae and Freddie Mac (collectively, the “GSEs”) debt financing volumes increased 102% year over year, led by a 287% increase in Freddie Mac volumes, which included a $1.7 billion portfolio in the first quarter of 2026. Walker & Dunlop continues to be a top GSE lender, with a 12.3% market share in the first quarter of 2026, up from 9.6% in the first quarter of 2025.
- HUD debt financing volume increased 225% in the first quarter of 2026 due to strong market demand for HUD construction financing. Walker & Dunlop is one of the largest HUD construction lenders.
- The 155% increase in brokered debt financing volume during the first quarter of 2026 reflected a strong supply of capital to the commercial real estate transaction markets from life insurance companies, banks, commercial mortgage-backed securities, and other private capital providers.
- Property sales volume increased 4% in the first quarter of 2026, as the macroeconomic fundamentals supporting the multifamily acquisitions market supported a strong start to the year. We outperformed the multifamily property sales market, which increased only slightly year over year.
DISCUSSION OF QUARTERLY RESULTS:
- Our servicing portfolio continues to grow, primarily as a result of additional Fannie Mae, Freddie Mac, and HUD (collectively, “Agency”) debt financing volumes over the past 12 months.
- During the first quarter of 2026, we added $2.4 billion of net loans to our servicing portfolio, and over the past 12 months, we added $10.7 billion of net loans to our servicing portfolio, with the growth led primarily by Fannie Mae and Freddie Mac loans.
- $14.7 billion of Agency loans in our servicing portfolio are scheduled to mature over the next two years. The maturing loans, with a weighted-average servicing fee of 28 basis points, represent only 11% of the total Agency loans in our portfolio. Over the next five years, 54% of Agency loans are expected to mature, providing an opportunity for us to recapitalize or sell these deals for our clients in the coming years.
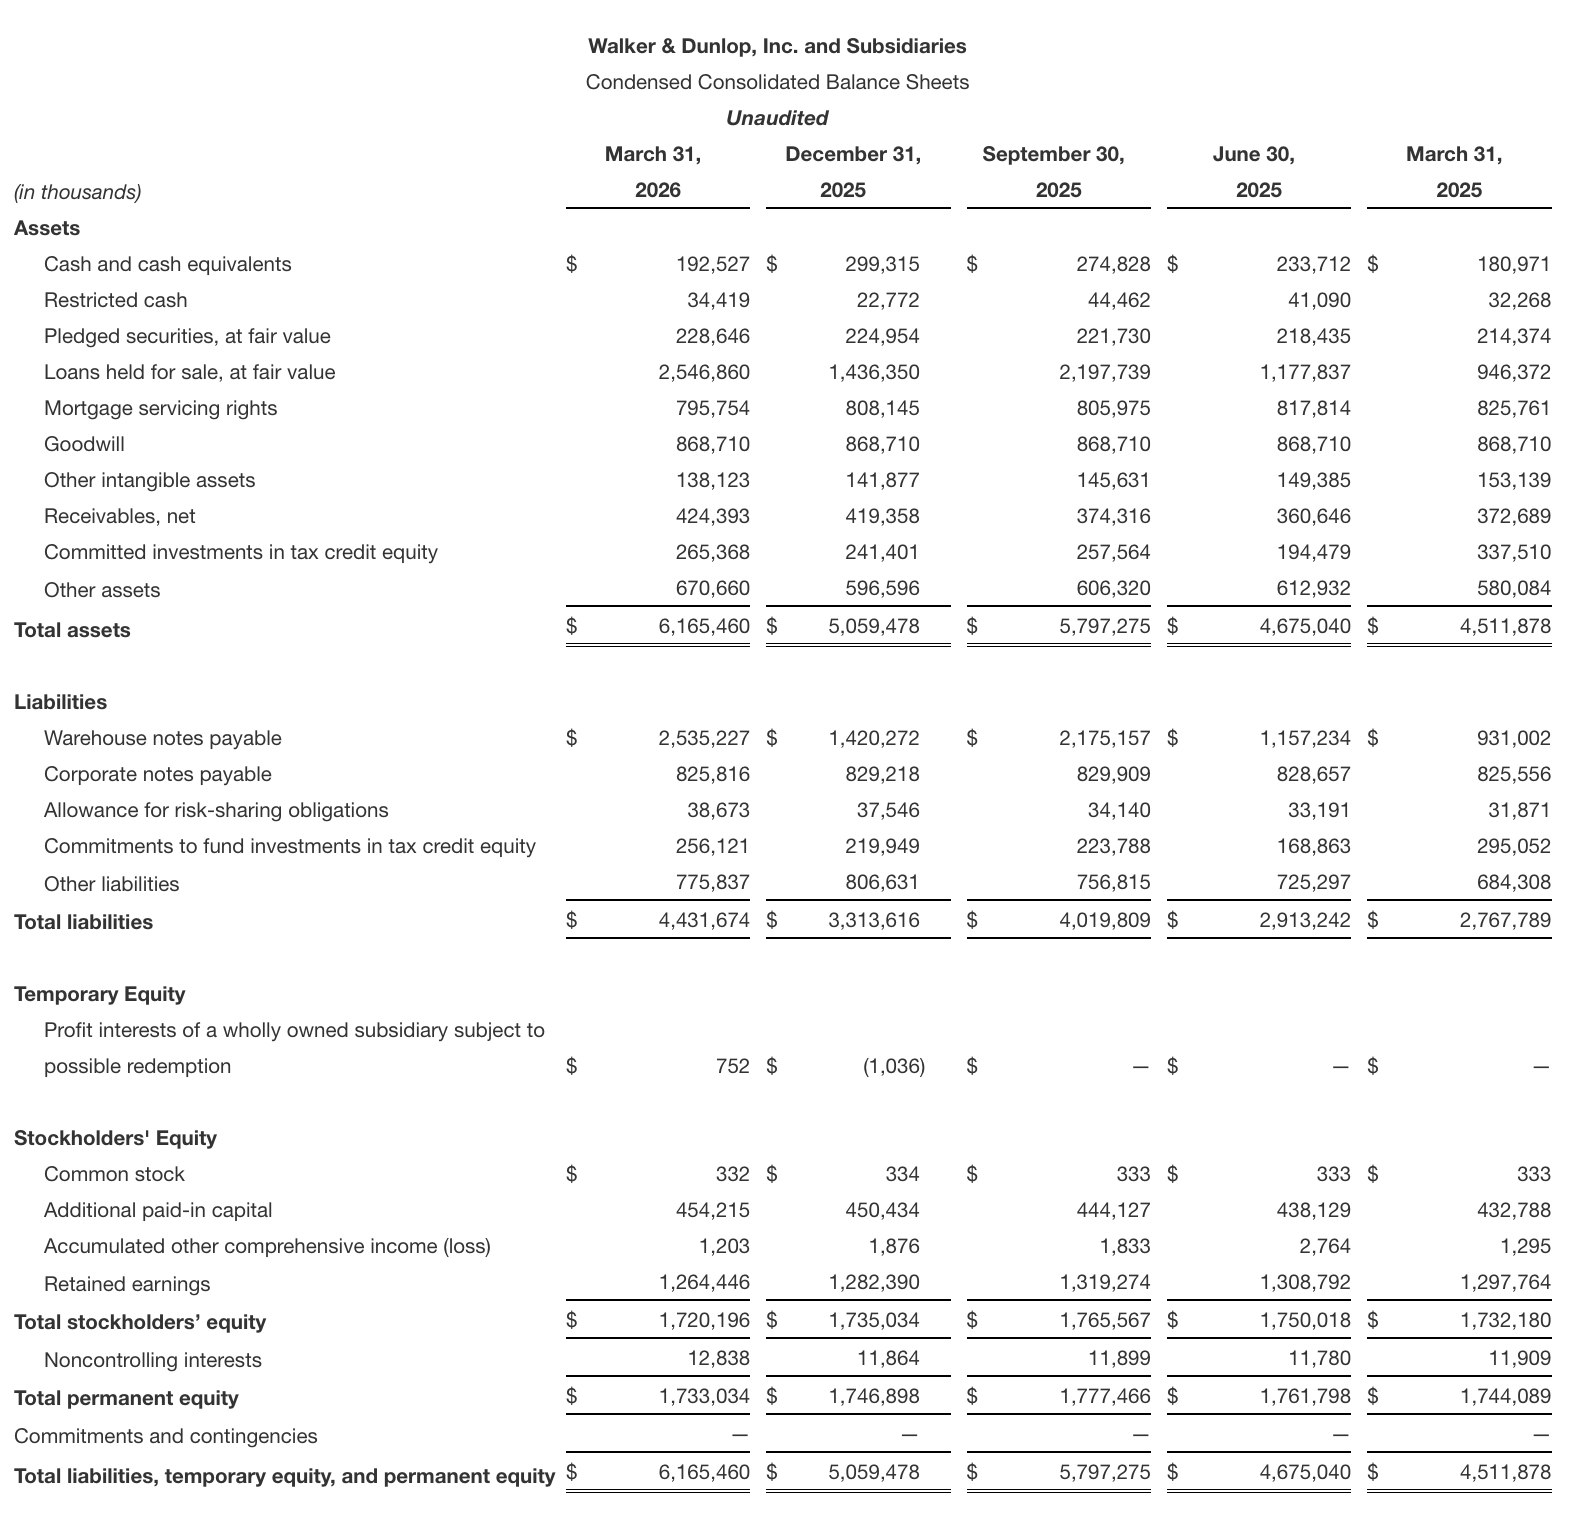
- The mortgage servicing rights (“MSRs”) associated with our servicing portfolio are reported at an amortized cost of $795.8 million as of March 31, 2026, while the fair value is estimated at $1.4 billion. The relative long-term contractual nature of the servicing rights, coupled with ancillary revenues earned from the portfolio, generate attractive upside and value above our cost basis.
- Assets under management totaled $18.5 billion as of March 31, 2026, and consisted of $15.9 billion of low-income housing tax credit (“LIHTC”) funds managed by our affordable housing investment management team, approximately $1.7 billion of debt funds, and $0.9 billion of equity funds, managed by our registered investment advisor, WDIP.
DISCUSSION OF KEY PERFORMANCE METRICS:
- Total revenues increased 27% this quarter, largely driven by higher transaction activity, which contributed to growth in origination fees and MSR income, as well as expansion of the managed portfolio, resulting in higher recurring servicing fees and related revenues. Total expenses increased 19%, reflecting higher variable personnel costs that scale with transaction-driven revenue growth, an increase in amortization and depreciation expenses, as well as an increase in indemnified and repurchased loan expenses due to a higher balance of repurchased loans year over year, partially offset by a decrease in other operating expenses.
- The increases in net income and diluted earnings per share were primarily driven by growth across both operating segments-Capital Markets and Servicing and Asset Management. Capital Markets performance benefited from a significant increase in transaction activity, which drove meaningful operating leverage as volumes scaled. This activity continued to expand our managed portfolio, which grew 7% year over year, supporting higher recurring revenue and earnings in Servicing and Asset Management. The resulting increase in income before taxes contributed to an improved operating margin and was a key driver of higher return on equity.
- The 14% increase in adjusted EBITDA was largely due to higher origination fees and servicing fees, partially offset by increases in personnel expenses, costs to operate indemnified and repurchased loans, and net income attributable to noncontrolling interest and temporary equity holders.
- Adjusted core EPS increased 20%, largely for the same reasons that adjusted EBITDA increased.
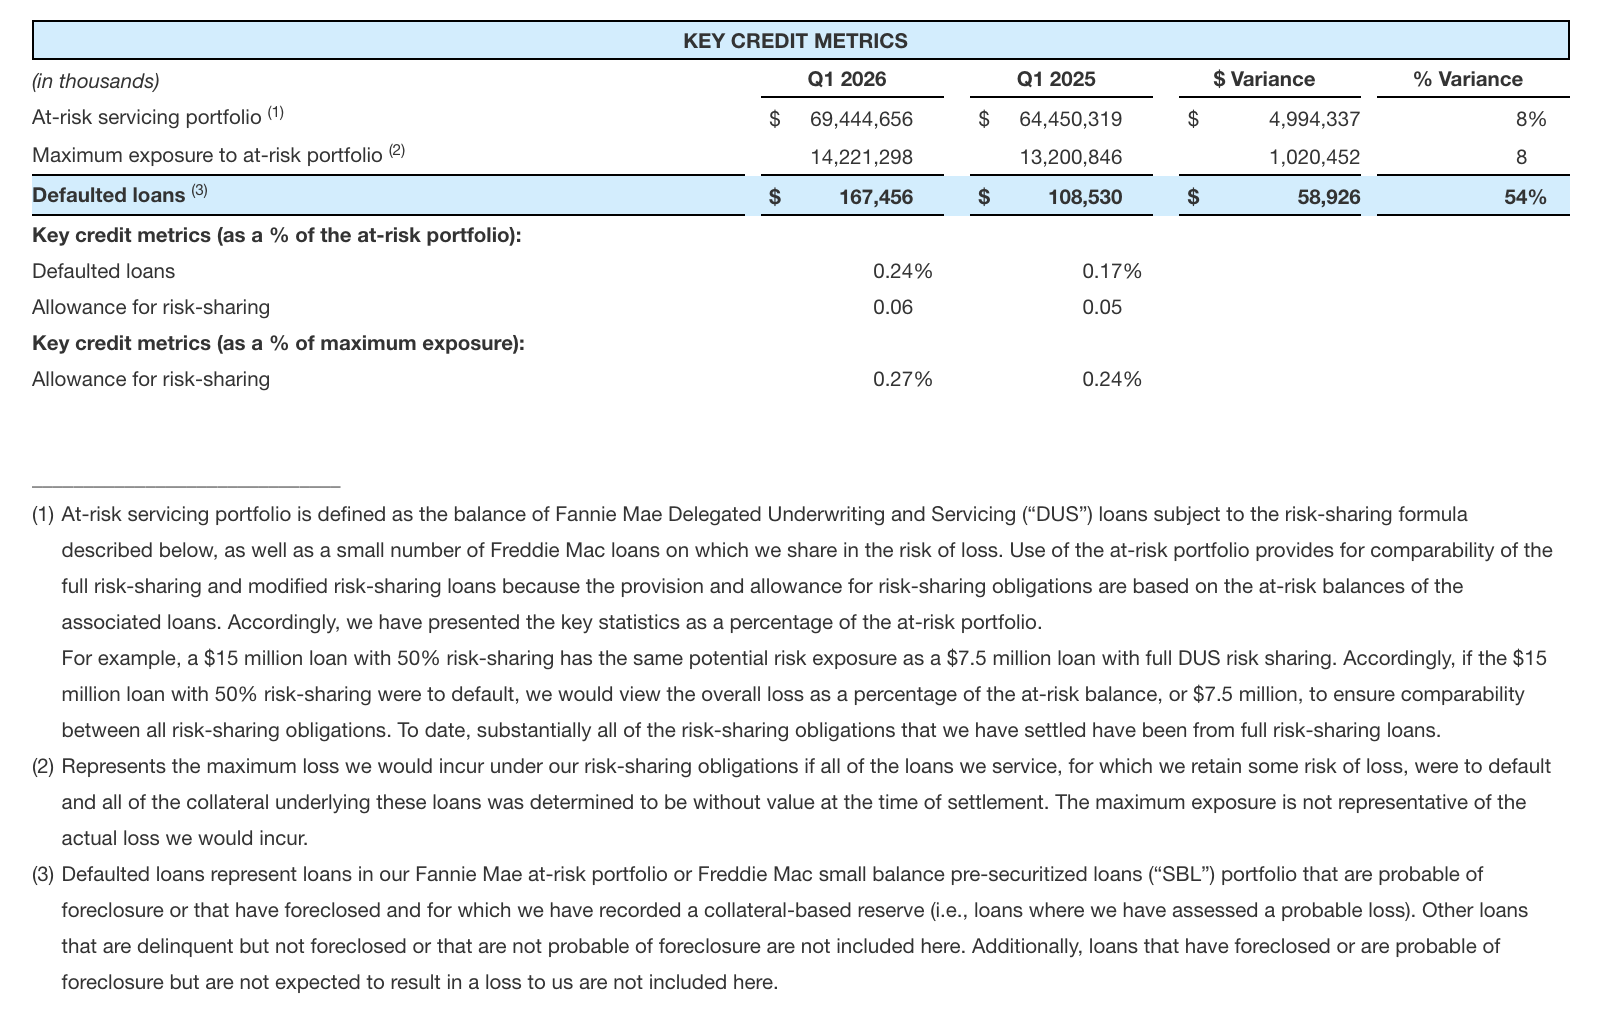
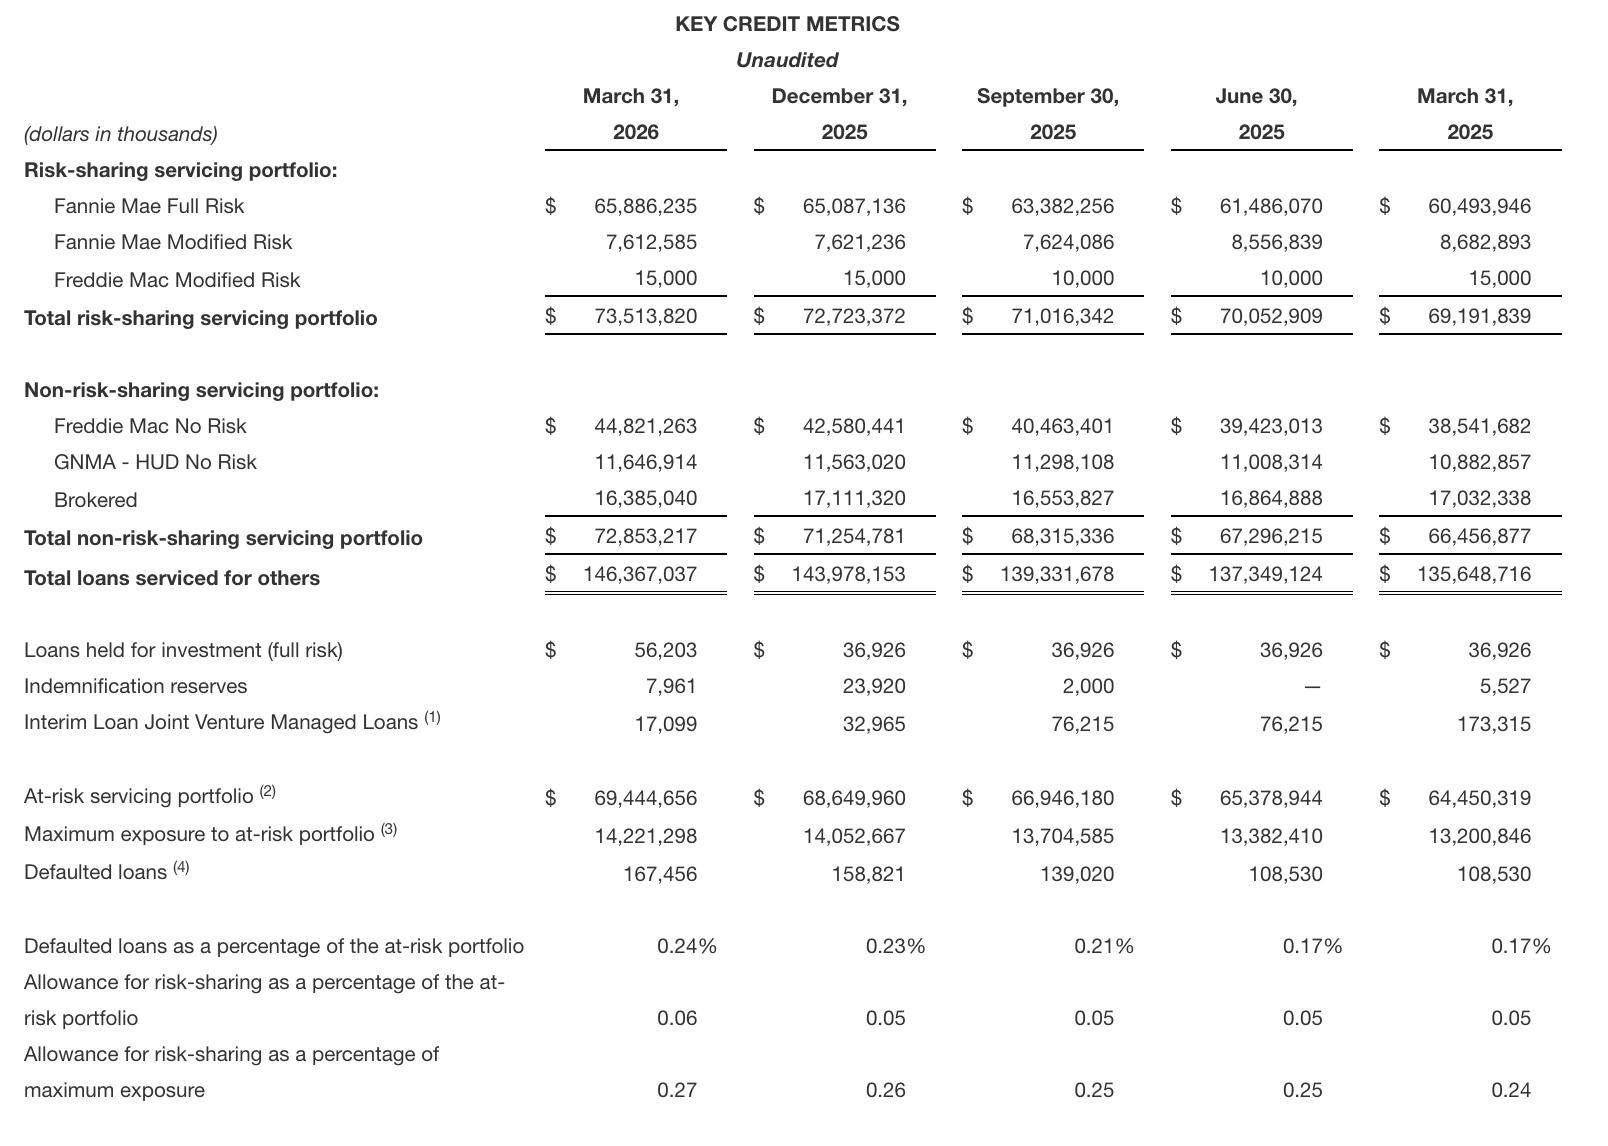
DISCUSSION OF KEY CREDIT METRICS:
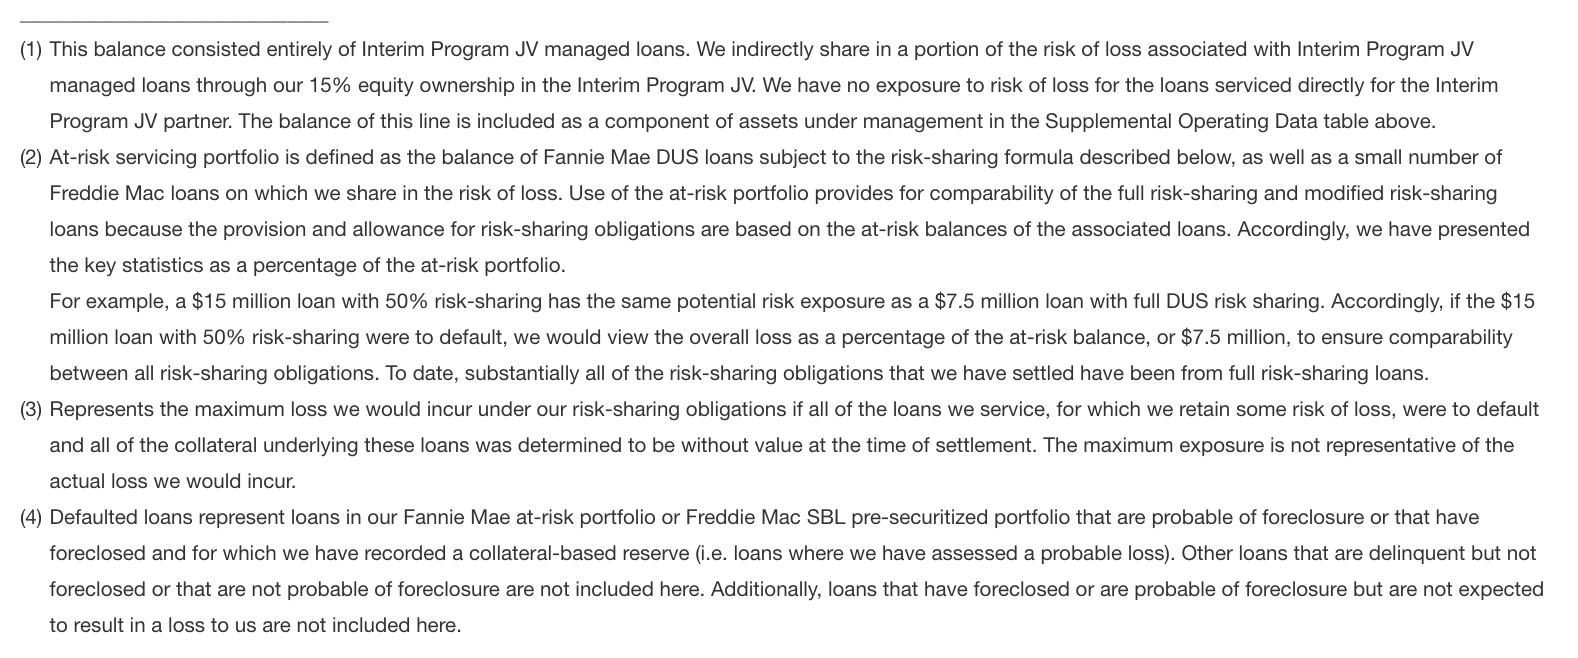
- Our at-risk servicing portfolio, which is comprised of loans subject to a defined risk-sharing formula, increased primarily due to the level of Fannie Mae loans added to the portfolio during the past 12 months. We take credit risk exclusively on loans backed by multifamily assets and have no credit exposure to losses in any other sector of the commercial real estate lending market.
- As of March 31, 2026, 14 at-risk loans were in default with an aggregate unpaid principal balance (“UPB”) of $167.5 million, compared to 14 loans with an aggregate UPB of $158.8 million at December 31, 2025, and eight loans with an aggregate UPB of $108.5 million as of March 31, 2025. The collateral-based reserves on defaulted loans were $13.3 million and $7.5 million as of March 31, 2026 and 2025, respectively. The approximately 3,200 remaining loans in the at-risk servicing portfolio continue to exhibit strong credit quality, with low levels of delinquencies and strong operating performance of the underlying properties in the portfolio.
- We recorded a provision for credit losses of $4.1 million in the first quarter of 2026, primarily related to initial loss reserves for loans that defaulted during the quarter. Of this amount, $2.5 million was associated with loans that we indemnified in the fourth quarter of 2025.
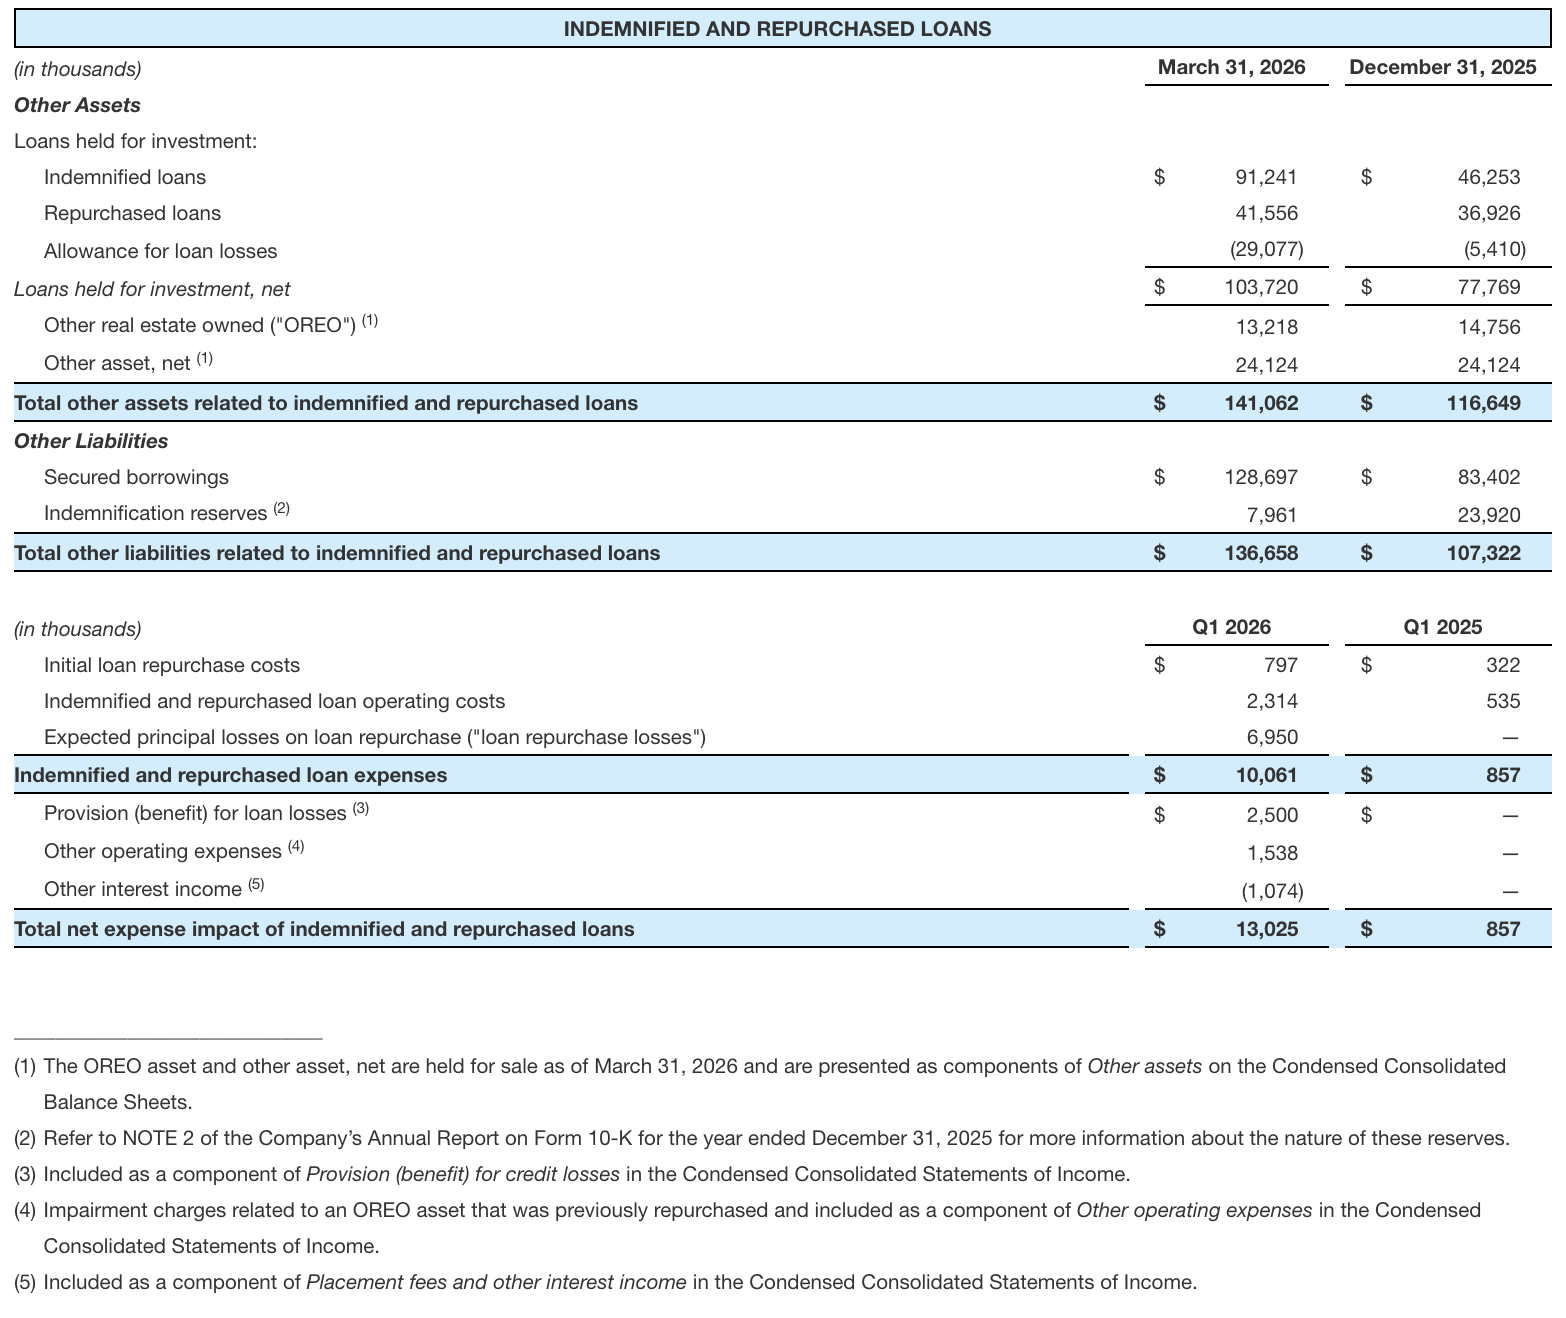
DISCUSSION OF INDEMNIFIED AND REPURCHASED LOANS:
- We continue to execute on our plan to reduce exposure to repurchased loans, with total repurchased loans declining to $191.9 million at March 31, 2026, compared to $221.6 million at December 31, 2025.
- In the second quarter, we entered into an indemnification agreement for a $34.3 million portfolio of loans without the requirement to repurchase the portfolio, reducing our potential repurchase exposure. The portfolio has performed well since origination, and the matters leading to the indemnification are not indicative of underlying credit concerns. This reduction was partially offset by the repurchase of a loan with an outstanding UPB of $4.6 million.
- We expect continued progress in reducing our exposure to repurchased loans through asset sales over time, which should lower related credit charges and operating costs as these assets are resolved.
FIRST QUARTER 2026 - FINANCIAL RESULTS BY SEGMENT
Interest expense on corporate debt is determined at a consolidated corporate level and allocated to each segment proportionally based on each segment’s use of that corporate debt. Income tax expense is determined at a consolidated corporate level and allocated to each segment proportionally based on each segment’s income before taxes, except for significant, one-time tax activities, which are allocated entirely to the segment impacted by the tax activity. The following details explain the changes in these expense items at a consolidated corporate level:
- Interest expense on corporate debt, which pays a variable interest rate, decreased 4% year over year, to $14.9 million primarily due to lower average interest rates during the first quarter of 2026 compared to the first quarter of 2025.
- Income tax expense increased $5.5 million, or 218% year over year, primarily driven by a 395% increase in income before taxes during the first quarter of 2026 compared to the first quarter of 2025. Additionally, we recognized a higher balance of realizable tax shortfall. We recognized a $2.0 million shortfall during the first quarter of 2026, compared to a $1.3 million shortfall during the first quarter of 2025, resulting from changes between the grant date fair value and vesting date fair value of share-based compensation awards that vested during the first quarter of 2026. Absent the impact from tax shortfalls, income tax expense increased 394%, which is consistent with the growth in income before taxes.
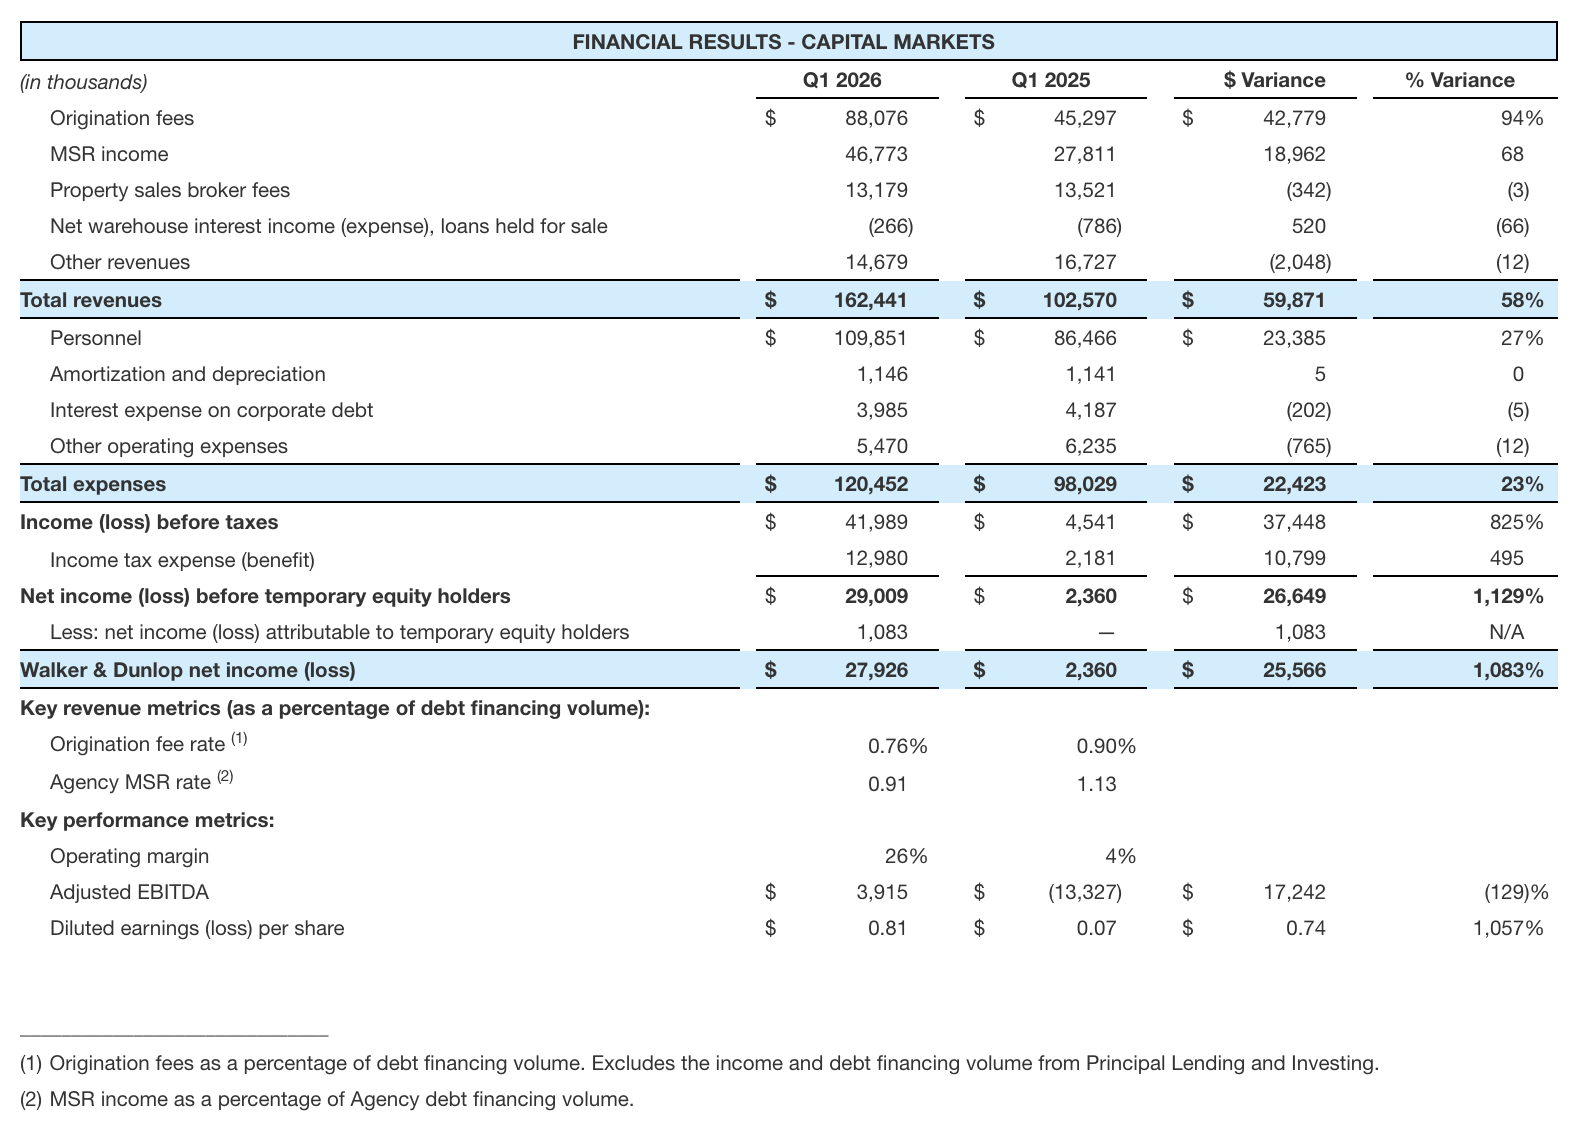
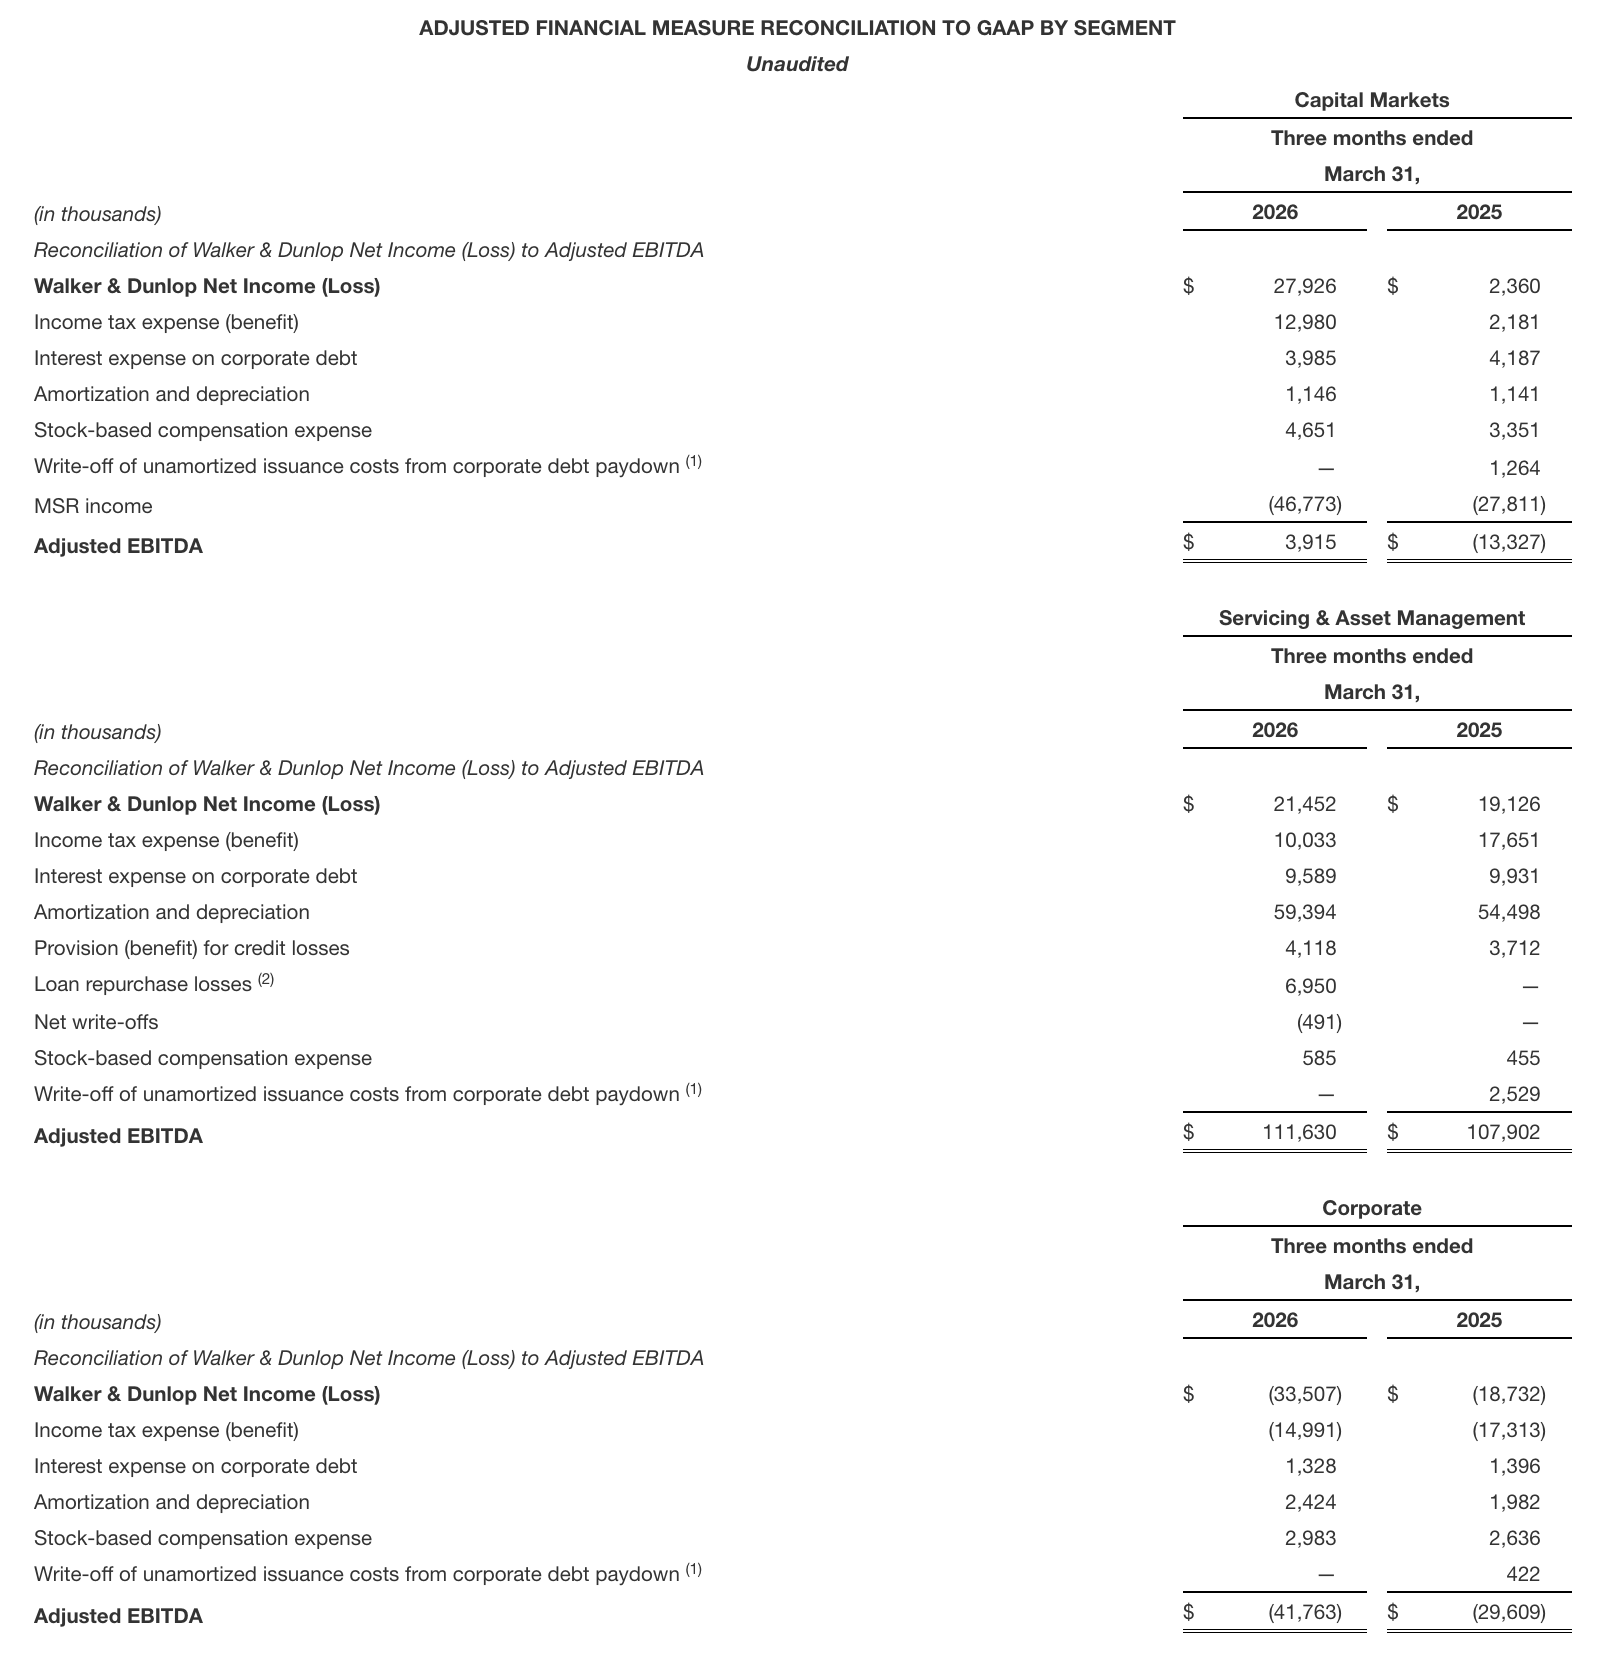
CAPITAL MARKETS – DISCUSSION OF QUARTERLY RESULTS:
The Capital Markets segment includes our Agency lending, debt brokerage, property sales, appraisal and valuation services, investment banking, and housing market research businesses.
- Origination fees increased due to higher debt financing volume, partially offset by a decline in the origination fee rate. The lower fee rate was primarily driven by the origination of a $1.7 billion Freddie Mac portfolio in the first quarter of 2026 with no comparable activity in the prior year and a shift in volume mix towards brokered transactions. Portfolio transactions also generally have lower fee rates than non-portfolio transactions. Brokered transactions, which carry lower fee margins, represented 55% of total debt financing volume in the first quarter of 2026, compared to 49% in the first quarter of 2025.
- MSR income increased due to higher debt financing volumes, partially offset by a decrease in the Agency MSR rate. The lower Agency MSR rate was primarily driven by a shift in Agency volume mix, including the $1.7 billion portfolio in the first quarter of 2026. Freddie Mac transactions, which carry lower servicing fees, represented 61% of Agency volume in the first quarter of 2026 compared to 33% in the first quarter of 2025, and portfolio transactions are also priced at lower servicing fees. A higher weighted average servicing fee on Fannie Mae volume partially offset the impact of the Agency volume mix and portfolio transaction.
- Other revenues decreased due to lower investment banking revenues, partially offset by increases in application and appraisal revenues.
- Personnel expense increased in the first quarter of 2026, primarily reflecting higher variable compensation associated with increased transaction volumes, as well as growth in salaries, benefits and subjective bonuses. Personnel expense declined to 68% of segment revenue from 84% last year, demonstrating the operating leverage and scalability of the platform as volumes increased.
- The increase in adjusted EBITDA reflects higher origination fees, partially offset by increased personnel expenses.
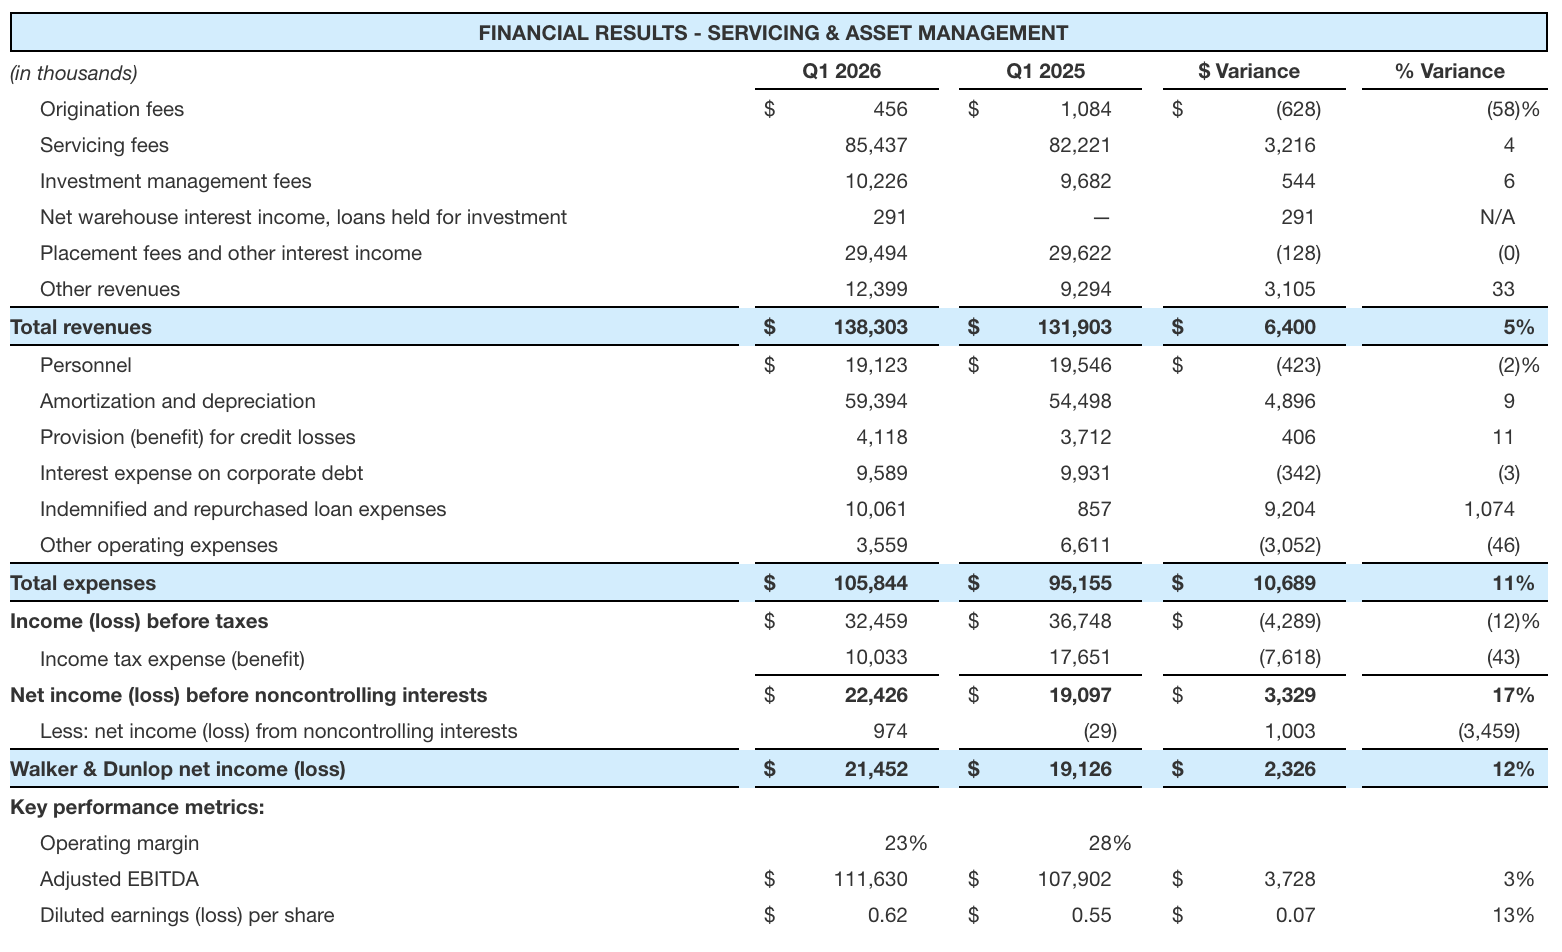
SERVICING & ASSET MANAGEMENT – DISCUSSION OF QUARTERLY RESULTS:
The Servicing & Asset Management segment includes loan servicing, principal lending and investing, management of third-party capital invested in tax credit equity funds focused on the affordable housing sector and other commercial real estate, and real estate-related investment banking and advisory services.
- The servicing portfolio increased $10.7 billion over the past 12 months and was the principal driver of the growth in servicing fees year over year, partially offset by a decrease in the weighted average servicing fee across the portfolio.
- Other revenues increased as a result of growth in prepayment fees and other LIHTC fees, partially offset by a decrease in income from equity-method investments. Prepayment fees increased as a result of higher prepayment activity driven by the interest rate environment and increased refinancing activity. LIHTC fees increased as a result of higher fee income and reimbursable fees from our LIHTC operations. Income from equity method investments decreased due to elevated performance from our equity method investments in 2025.
- Amortization and depreciation increased due to the combination of higher recurring amortization of mortgage servicing rights and write-offs due to loan prepayments.
- The increase in indemnified and repurchased loan expenses was primarily driven by the increase in loan repurchase losses coupled with an increase in repurchased loans operating costs as outlined in the Indemnified and Repurchased Loans section above.
- Other operating expenses decreased largely due to a true up to the estimate of losses of certain affordable assets that we sold in the first quarter of 2026, with no comparable activity in the prior year.
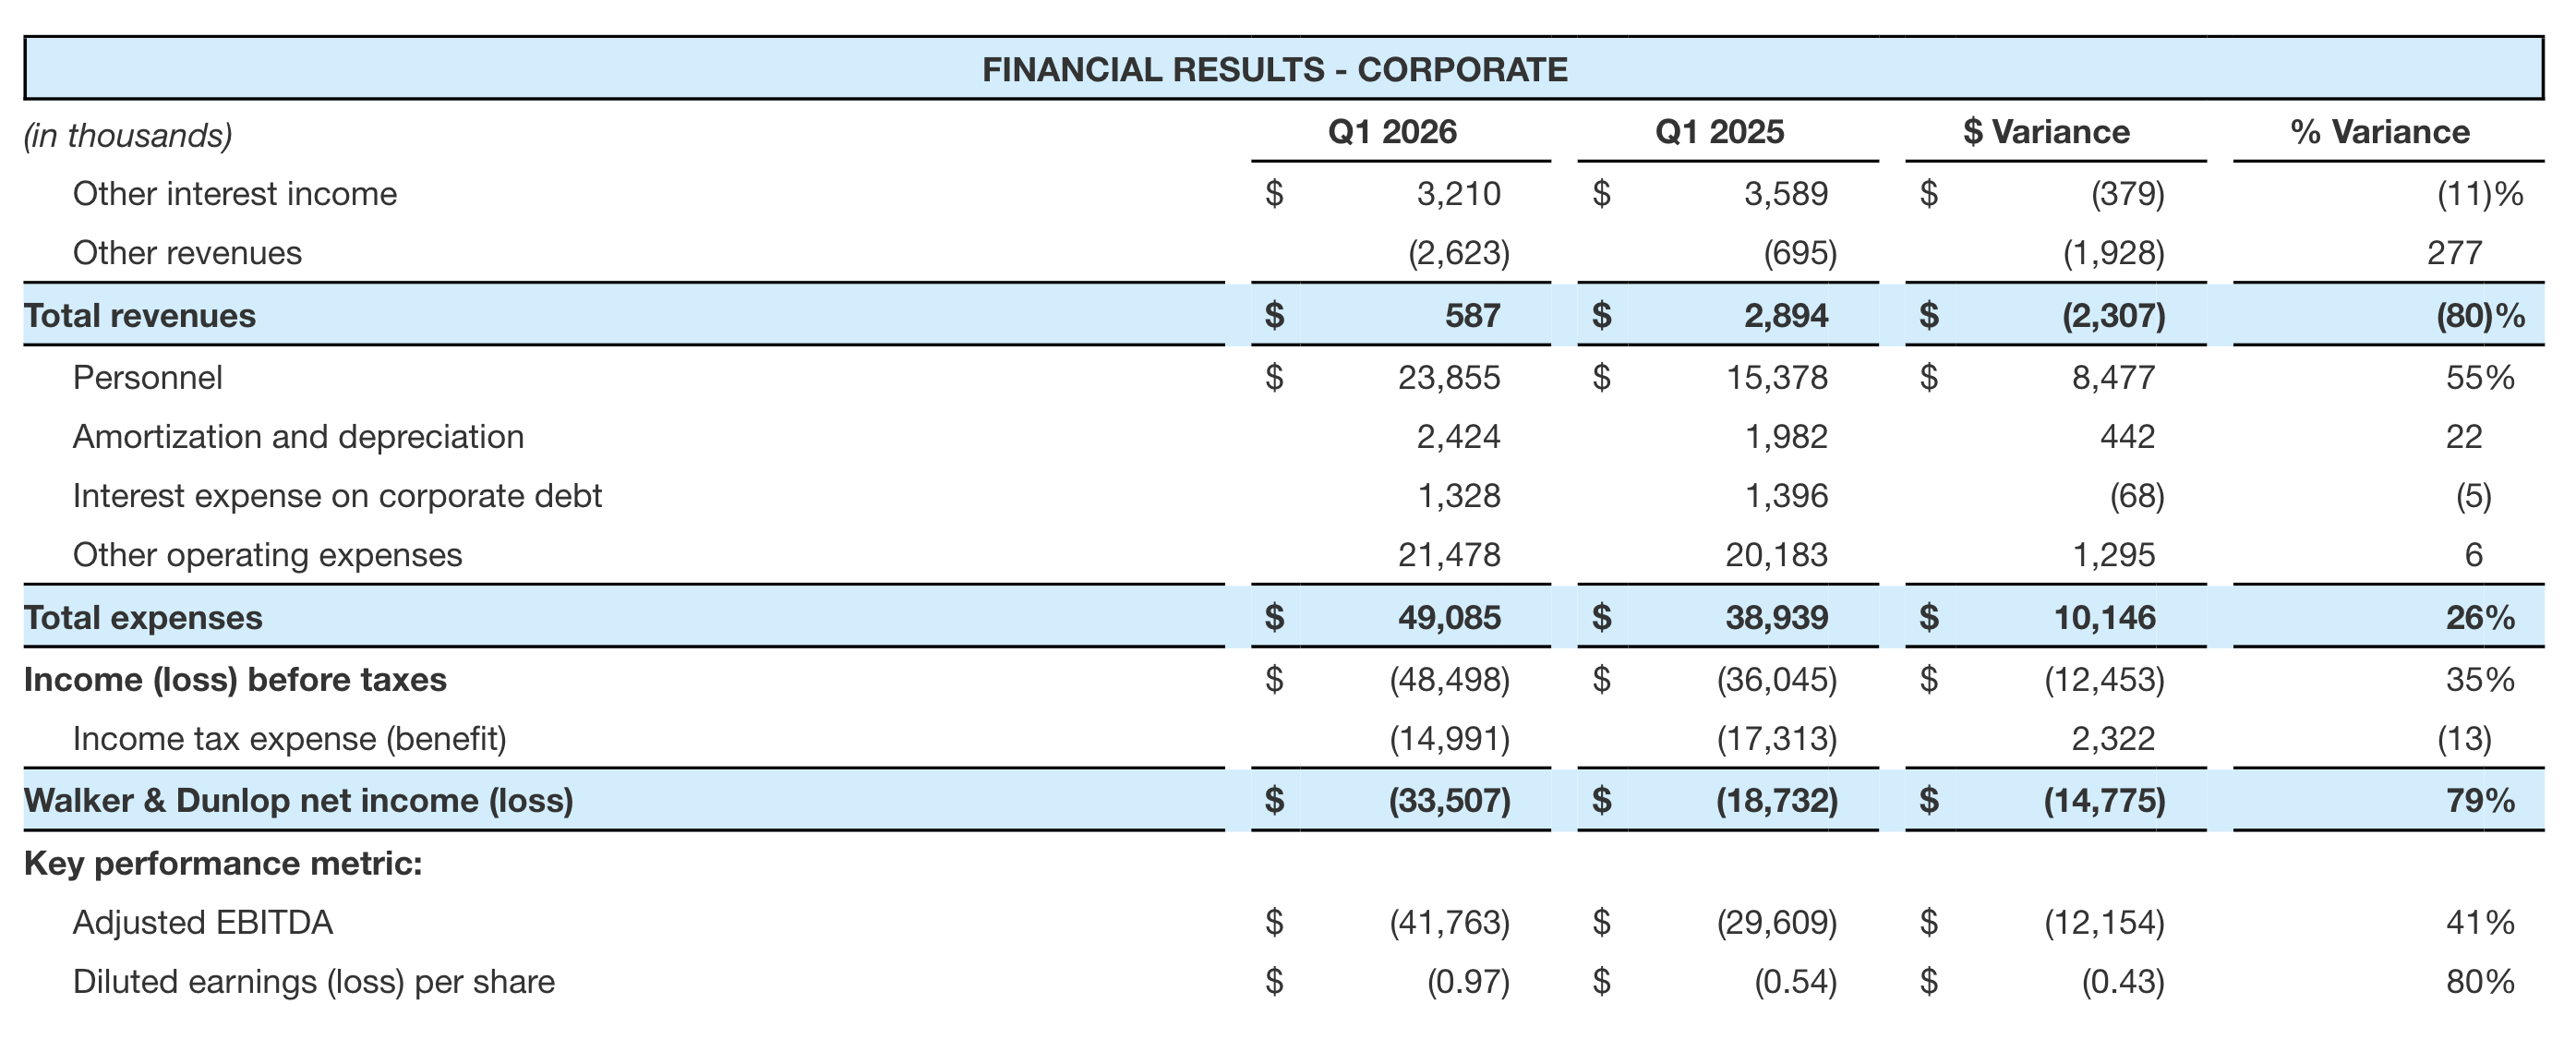
CORPORATE – DISCUSSION OF QUARTERLY RESULTS:
The Corporate segment consists of corporate-level activities including accounting, information technology, legal, human resources, marketing, internal audit, and various other corporate groups (“support functions”). The Company does not allocate costs from these support functions to its other segments in presenting segment operating results.
- The decrease in other revenues was primarily due to lower income from equity-method investments.
- Personnel expenses increased due to higher salaries and benefits associated with a 9% increase in average segment headcount to support growth in transaction activity, as well as higher subjective bonus accruals reflecting improved financial performance year over year.
CAPITAL SOURCES AND USES
On May 6, 2026, the Company’s Board of Directors declared a dividend of $0.68 per share for the second quarter of 2026. The dividend will be paid on June 4, 2026, to all holders of record of the Company’s restricted and unrestricted common stock as of May 21, 2026.
On February 13, 2026, our Board of Directors authorized the repurchase of up to $75.0 million of the Company’s outstanding common stock over a 12-month period starting from February 26, 2026 (the “2026 Stock Repurchase Program”). During the first quarter of 2026, the Company repurchased 283 thousand shares under the 2026 Stock Repurchase Program at a weighted-average price of $47.13 per share and immediately retired the shares, reducing stockholders’ equity by $13.3 million. As of March 31, 2026, the Company had $61.7 million of authorized share repurchase capacity remaining under the 2026 Stock Repurchase Program.
Any repurchases made pursuant to the 2026 Stock Repurchase Program will be made in the open market or in privately negotiated transactions, from time to time, as permitted by federal securities laws and other legal requirements. The timing, manner, price and amount of any repurchases will be determined by the Company in its discretion and will be subject to economic and market conditions, stock price, applicable legal requirements and other factors. The repurchase program may be suspended or discontinued at any time.
CONFERENCE CALL INFORMATION
Listeners can access the Company’s quarterly conference call for more information regarding our financial results via the dial-in number and webcast link below. Presentation materials related to the conference call will be posted to the Investor Relations section of the Company’s website prior to the call. An audio replay will also be available on the Investor Relations section of the Company’s website, along with the presentation materials.
Earnings Call: Thursday, May 7, 2026, at 8:30 a.m. EDT
Phone: (800) 330-6710 from within the United States; (312) 471-1353 from outside the United States
Confirmation Code: 7877733
Webcast Link: https://event.webcasts.com/starthere.jsp?ei=1752006&tp_key=c5facb3699
ABOUT WALKER & DUNLOP
Walker & Dunlop (NYSE: WD) is one of the largest commercial real estate finance and advisory services firms in the United States and internationally. Our ideas and capital create communities where people live, work, shop, and play. Our innovative people, breadth of our brand, and our technological capabilities make us one of the most insightful and client-focused firms in the commercial real estate industry.
NON-GAAP FINANCIAL MEASURES
To supplement our financial statements presented in accordance with United States generally accepted accounting principles (“GAAP”), the Company uses adjusted EBITDA, adjusted core net income, and adjusted core EPS, which are non-GAAP financial measures. The presentation of these non-GAAP financial measures is not intended to be considered in isolation or as a substitute for, or superior to, the financial information prepared and presented in accordance with GAAP. When analyzing our operating performance, readers should use adjusted EBITDA, adjusted core net income, and adjusted core EPS in addition to, and not as an alternative for, net income and diluted EPS.
Adjusted core net income and adjusted core EPS represent net income adjusted for amortization and depreciation, provision (benefit) for credit losses, net write-offs based on the final resolution of the defaulted loans or collateral, the fair value of expected net cash flows from servicing, net of guaranty obligation, the income statement impact from periodic revaluation and accretion associated with contingent consideration liabilities related to acquired companies, goodwill impairment, loan repurchase losses and other adjustments. Adjusted EBITDA represents net income before income taxes, interest expense on our corporate debt, and amortization and depreciation, adjusted for provision (benefit) for credit losses, net write-offs based on the final resolution of the defaulted loans or collateral, loan repurchase losses, stock-based compensation, the fair value of expected net cash flows from servicing, net of guaranty obligation, the write-off of the unamortized balance of deferred issuance costs associated with the repayment of a portion of our corporate debt, goodwill impairment, and contingent consideration liability fair value adjustments when the fair value adjustment is a triggering event for a goodwill impairment assessment. Furthermore, adjusted EBITDA is not intended to be a measure of free cash flow for our management’s discretionary use, as it does not reflect certain cash requirements such as tax and debt service payments. The amounts shown for adjusted EBITDA may also differ from the amounts calculated under similarly titled definitions in our debt instruments, which are further adjusted to reflect certain other cash and non-cash charges that are used to determine compliance with financial covenants. Because not all companies use identical calculations, our presentation of adjusted EBITDA, adjusted core net income and adjusted core EPS may not be comparable to similarly titled measures of other companies.
We use adjusted EBITDA, adjusted core net income, and adjusted core EPS to evaluate the operating performance of our business, for comparison with forecasts and strategic plans and for benchmarking performance externally against competitors. We believe that these non-GAAP measures, when read in conjunction with the Company’s GAAP financial information, provide useful information to investors by offering:
- the ability to make more meaningful period-to-period comparisons of the Company’s on-going operating results;
- the ability to better identify trends in the Company’s underlying business and perform related trend analyses; and
- a better understanding of how management plans and measures the Company’s underlying business.
We believe that these non-GAAP financial measures have limitations in that they do not reflect all of the amounts associated with the Company’s results of operations as determined in accordance with GAAP and that these non-GAAP financial measures should only be used to evaluate the Company’s results of operations in conjunction with the Company’s GAAP financial information. For more information on adjusted EBITDA, adjusted core net income, and adjusted core EPS, refer to the section of this press release below titled “Adjusted Financial Measure Reconciliation to GAAP” and “Adjusted Financial Measure Reconciliation to GAAP By Segment.”
FORWARD-LOOKING STATEMENTS
Some of the statements contained in this press release may constitute forward-looking statements within the meaning of the federal securities laws. Forward-looking statements relate to expectations, projections, plans and strategies, anticipated events or trends and similar expressions concerning matters that are not historical facts. In some cases, you can identify forward-looking statements by the use of forward-looking terminology such as “may,” “will,” “should,” “expects,” “intends,” “plans,” “anticipates,” “believes,” “estimates,” “predicts,” or “potential” or the negative of these words and phrases or similar words or phrases that are predictions of or indicate future events or trends and which do not relate solely to historical matters. You can also identify forward-looking statements by discussions of strategy, plans, or intentions. The forward-looking statements contained in this press release reflect our current views about future events and are subject to numerous known and unknown risks, uncertainties, assumptions and changes in circumstances that may cause actual results to differ significantly from those expressed or contemplated in any forward-looking statement.
While forward-looking statements reflect our good faith projections, assumptions and expectations, they are not guarantees of future results. Furthermore, we disclaim any obligation to publicly update or revise any forward-looking statement to reflect changes in underlying assumptions or factors, new information, data or methods, future events or other changes, except as required by applicable law. Factors that could cause our results to differ materially include, but are not limited to: (1) general economic conditions and multifamily and commercial real estate market conditions, (2) changes in interest rates, (3) regulatory and/or legislative changes to Freddie Mac, Fannie Mae or HUD, (4) our ability to retain and attract loan originators and other professionals, (5) success of our various investments funded with corporate capital, (6) changes in federal government fiscal and monetary policies, including any constraints or cuts in federal funds allocated to HUD for loan originations, and (7) our obligations to repurchase or indemnify the GSEs for loans we originate under their programs, including additional charges or losses related to loans we have already repurchased or indemnified and new repurchase requests we may receive from the GSEs related to the previously identified instances of borrower fraud, additional instances of borrower fraud, or other reasons.
For a further discussion of these and other factors that could cause future results to differ materially from those expressed or contemplated in any forward-looking statements, see the section titled “Risk Factors” in our most recent Annual Report on Form 10-K and any updates or supplements in subsequent Quarterly Reports on Form 10-Q and our other filings with the SEC. Such filings are available publicly on our Investor Relations web page at www.walkerdunlop.com.

Walker & Dunlop
Walker & Dunlop reported a strong first quarter of 2026, highlighted by a significant increase in total transaction volume to $13.7 billion, a 94% increase year over year.
Services
Our comprehensive CRE platform offers you both entity-level and property-level finance and advisory services.
Specialties & Sectors
Affordable, multifamily, industrial, and more…you name it and we have the skills and expertise to handle it.